Genomics vs Proteomics vs Transcriptomics: What Researchers Need to Know

If you’ve worked in biology research in the past decade, you’ve encountered the term “omics” in some form. Genomics, proteomics, transcriptomics, metabolomics, epigenomics. Each represents a different layer of biological information, a different lens on the same cell or organism. But knowing which layer to study, when each is most informative, and how they relate to one another remains a practical challenge for many research teams.
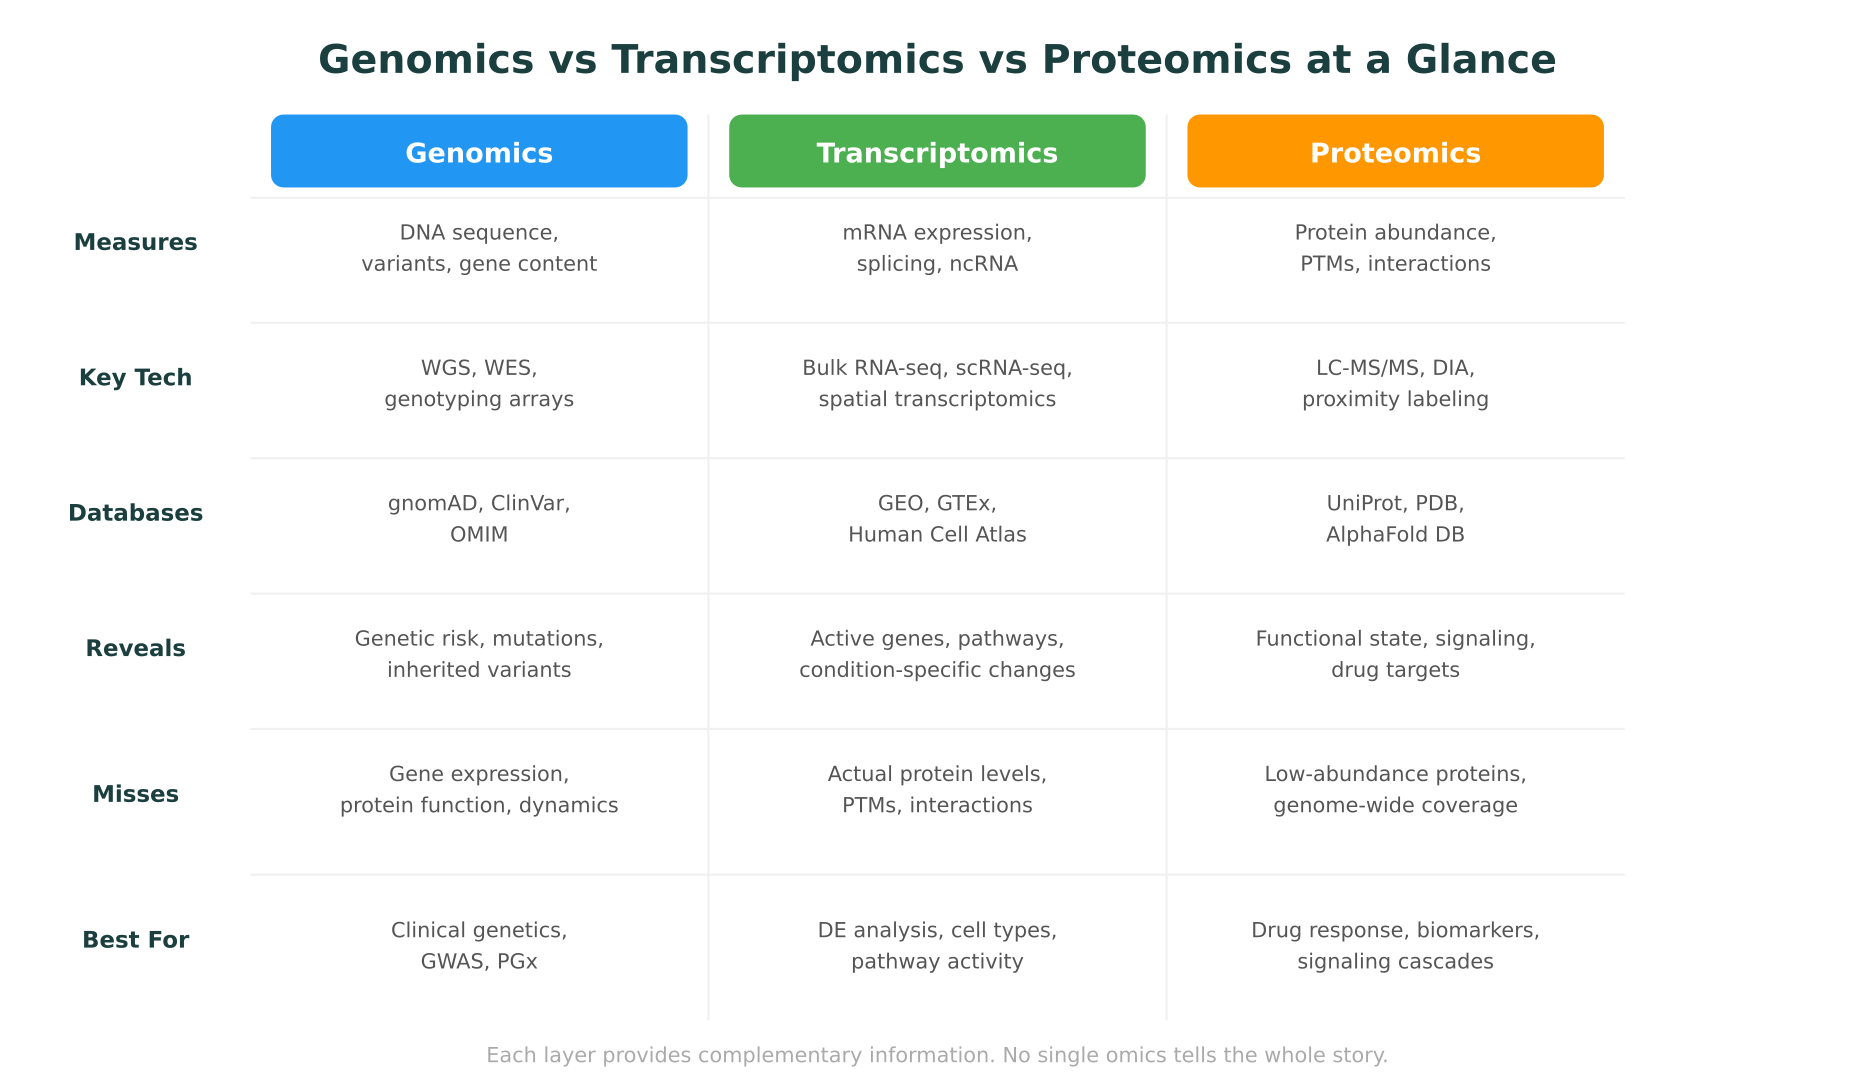
This post breaks down the three most established omics fields, genomics vs proteomics vs transcriptomics, covering what each measures, how the data is generated, what each reveals that the others miss, and when multi-omics integration is worth the added complexity.
Genomics: The Blueprint
Genomics studies an organism’s complete DNA sequence, the full set of genetic instructions encoded in the genome. It answers the question: what could this organism potentially do?
What genomics measures
- DNA sequence variants: single nucleotide variants (SNVs), insertions/deletions (indels), structural variants, copy number variations
- Gene content: which genes are present, pseudogenes, non-coding elements
- Regulatory elements: promoters, enhancers, silencers encoded in the DNA sequence
Key technologies
Whole genome sequencing (WGS) reads the entire genome. The cost has dropped below $200 per genome as of 2025, down from roughly $3 billion for the first human genome completed in 2003. Illumina short-read sequencing dominates clinical applications, while Oxford Nanopore and PacBio long-read platforms are increasingly used for structural variant detection and phasing.
Whole exome sequencing (WES) targets only the protein-coding regions (roughly 1.5% of the genome). It’s cheaper and produces smaller datasets, making it the standard for clinical genetics when the question is about protein-altering variants.
Genotyping arrays (like those from Illumina or Affymetrix) interrogate known variant positions across the genome. They’re used in genome-wide association studies (GWAS) and pharmacogenomics panels.
Key databases
- gnomAD (Genome Aggregation Database): population allele frequencies from over 800,000 individuals across diverse ancestries
- ClinVar: clinical significance of genetic variants, with over 2.8 million variant submissions
- OMIM: catalog of human genes and genetic disorders, with over 16,000 entries
What genomics reveals
Genomics tells you what’s written in the DNA. It identifies inherited risk factors, somatic mutations in cancer, pharmacogenomic variants that affect drug metabolism, and structural variations that may cause disease. The genome is stable across all cells in an individual (with the exception of somatic mutations), making it a fixed reference.
What genomics misses
DNA is necessary but not sufficient. A gene may be present but never expressed. A variant may exist in the sequence but have no functional impact. Genomics alone cannot tell you whether a gene is active, how much protein it produces, or how that protein behaves in a specific tissue or condition. As geneticists often note: the genome is the same in every cell, but a neuron and a liver cell are very different.
Transcriptomics: The Activity Log
Transcriptomics measures the complete set of RNA transcripts in a cell or tissue at a given moment. If genomics is the blueprint, transcriptomics is the activity log: it shows which genes are actually being read.
What transcriptomics measures
- mRNA expression levels: how much messenger RNA each gene is producing
- Splice variants: alternative splicing patterns that produce different protein isoforms from the same gene
- Non-coding RNAs: long non-coding RNAs (lncRNAs), microRNAs (miRNAs), and other regulatory RNAs
- Allele-specific expression: whether one copy of a gene is more active than the other
Key technologies
Bulk RNA-seq measures average gene expression across a sample of thousands to millions of cells. It’s the workhorse of transcriptomics research, with well-established pipelines (STAR/HISAT2 for alignment, featureCounts/Salmon for quantification, DESeq2/edgeR for differential expression).
Single-cell RNA-seq (scRNA-seq) profiles gene expression in individual cells. 10x Genomics’ Chromium platform is the dominant technology, routinely processing tens of thousands of cells per experiment. scRNA-seq has revealed cell-type heterogeneity invisible in bulk measurements, including rare cell populations, transitional states, and cell-type-specific responses to treatment.
Spatial transcriptomics adds location information to expression data. Technologies like 10x Visium, MERFISH, and Slide-seq map gene expression onto tissue sections, preserving spatial context. Nature Methods named spatial multi-omics its Method of the Year in 2024.
Key databases
- Gene Expression Omnibus (GEO): over 6 million samples across 200,000+ studies
- GTEx (Genotype-Tissue Expression): gene expression across 54 human tissues from nearly 1,000 donors
- Human Cell Atlas: building a comprehensive reference of all human cell types using single-cell technologies
What transcriptomics reveals
Transcriptomics captures the dynamic state of gene expression. Unlike the genome, the transcriptome changes with cell type, developmental stage, disease state, drug treatment, and environmental conditions. It answers: which genes are active right now in this specific context?
Differential expression analysis can identify genes that are up- or down-regulated between conditions (e.g., tumor vs. normal, treated vs. untreated). Gene set enrichment analysis (GSEA) maps these changes onto known biological pathways.
What transcriptomics misses
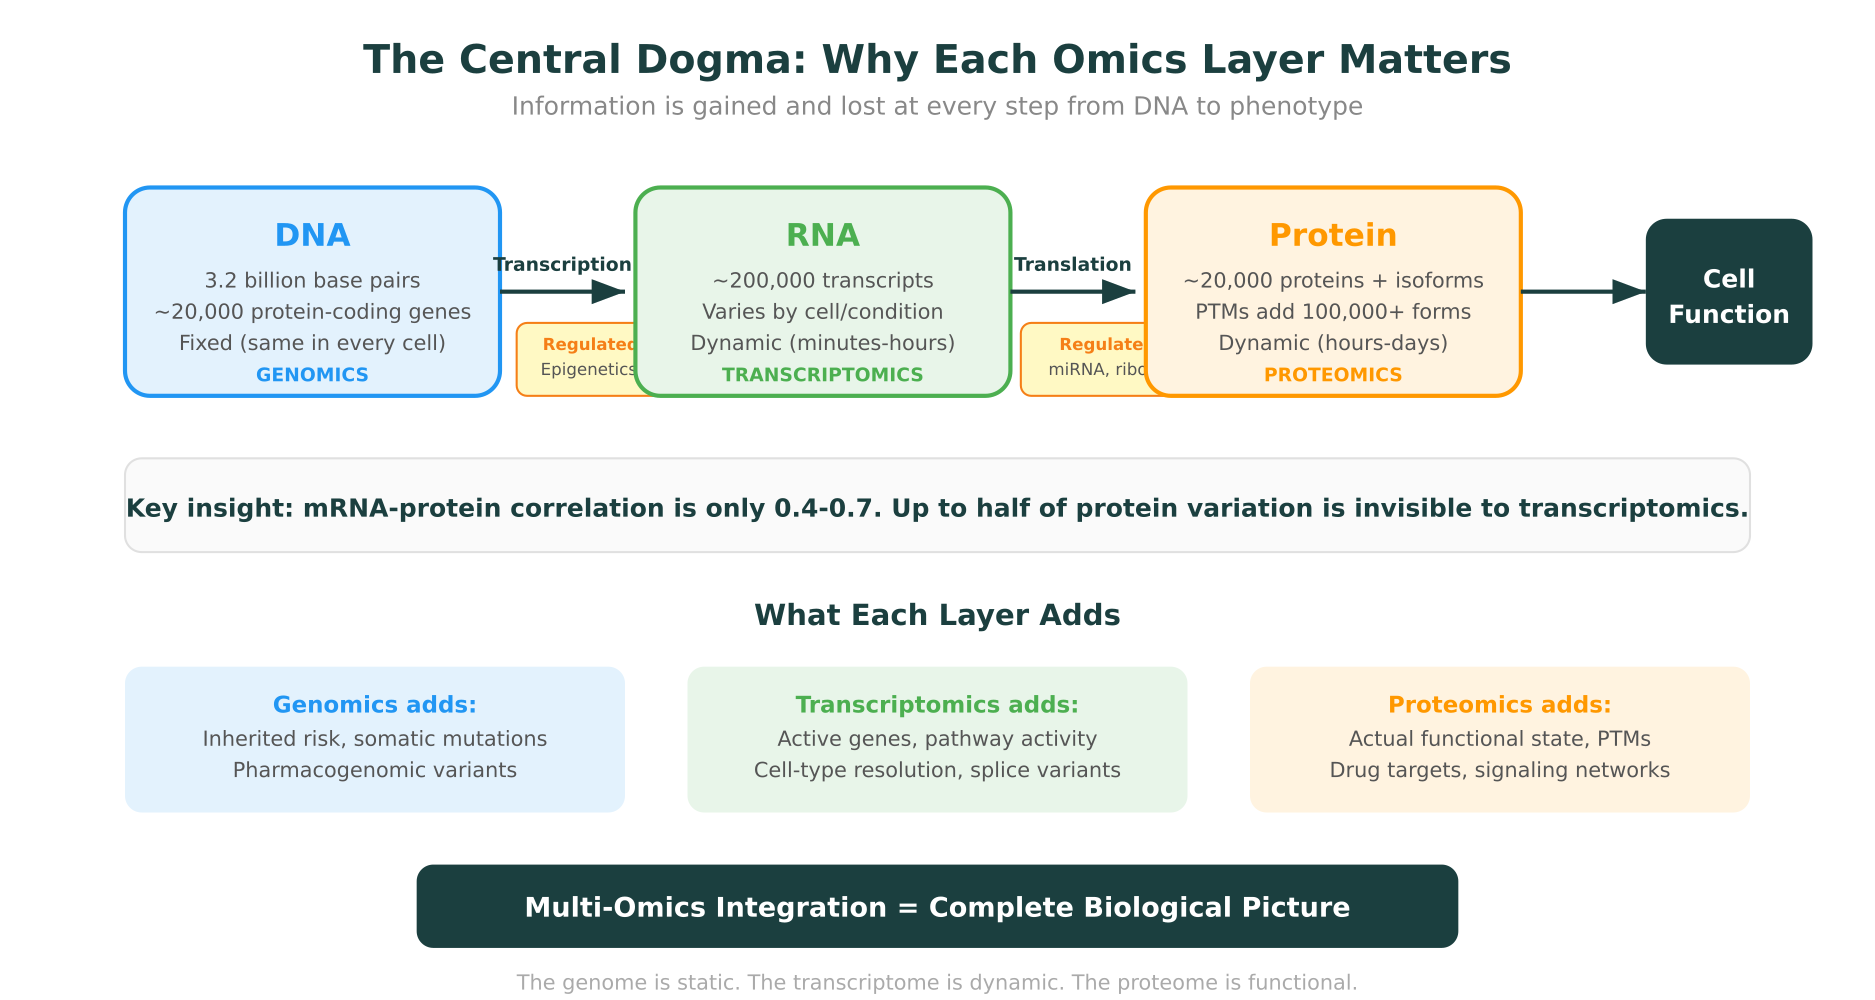
mRNA levels don’t always correlate with protein levels. Post-transcriptional regulation (mRNA stability, microRNA silencing), translational efficiency, and protein degradation all create a gap between transcript abundance and functional protein. Studies have shown that mRNA-protein correlations range from 0.4 to 0.7 depending on the system, meaning that up to half of the variance in protein levels cannot be explained by mRNA measurements alone (Molecular Systems Biology, 2023).
Additionally, RNA-seq captures a snapshot, but protein activity depends on post-translational modifications (phosphorylation, ubiquitination, glycosylation) that are invisible to transcriptomics.
Proteomics: The Functional Workforce
Proteomics studies the complete set of proteins in a cell, tissue, or organism. Proteins are the functional executors of biology: they catalyze reactions, transmit signals, provide structural support, and interact with drugs. If genomics is the blueprint and transcriptomics is the activity log, proteomics is the workforce actually doing the job.
What proteomics measures
- Protein abundance: how much of each protein is present
- Post-translational modifications (PTMs): phosphorylation, acetylation, ubiquitination, glycosylation, and hundreds of others that regulate protein function
- Protein-protein interactions: which proteins physically associate with each other
- Protein localization: where proteins reside within the cell
Key technologies
Mass spectrometry (MS) is the backbone of proteomics. Bottom-up (shotgun) proteomics digests proteins into peptides, separates them by liquid chromatography, and identifies them by tandem mass spectrometry (LC-MS/MS). Data-independent acquisition (DIA) methods like SWATH-MS have improved reproducibility and coverage.
Targeted proteomics (selected reaction monitoring, SRM/MRM) quantifies specific proteins with high precision, similar to how qPCR targets specific transcripts.
Proximity labeling (BioID, TurboID, APEX) identifies protein-protein interactions in living cells by tagging proteins near a bait protein with biotin.
Cryo-electron microscopy has transformed structural proteomics, enabling high-resolution structure determination for proteins that resist crystallization. The number of cryo-EM structures in the PDB has grown substantially, with over 20,000 entries as of 2026.
Key databases
- UniProt: the definitive protein sequence and function database, with over 570,000 manually reviewed entries (Swiss-Prot) and over 250 million unreviewed entries (TrEMBL)
- PDB (Protein Data Bank): over 220,000 experimentally determined 3D structures
- AlphaFold Database: predicted structures for over 214 million proteins
- PhosphoSitePlus: curated post-translational modification data
What proteomics reveals
Proteomics shows you what the cell is actually doing at the protein level. It captures functional states that genomics and transcriptomics cannot: which signaling pathways are active (via phosphoproteomics), which protein complexes have assembled, and how protein levels change in response to perturbation.
In drug discovery, proteomics is essential for understanding drug-target engagement, off-target effects, and resistance mechanisms. In clinical research, proteomic biomarkers can distinguish disease subtypes that look identical at the genomic level.
What proteomics misses
Proteomics has historically been limited by coverage: a typical mass spectrometry experiment detects 5,000-10,000 proteins out of the roughly 20,000 protein-coding genes in the human genome. Low-abundance proteins (many transcription factors, signaling molecules) are often below the detection limit. Proteomics also requires more sample material than RNA-seq and has lower throughput, making large-scale population studies more challenging.
When Single-Omics Isn’t Enough
Each omics layer provides a partial view. The power of multi-omics comes from combining these views to surface insights that no single layer can provide alone.
Real examples of multi-omics advantage
Cancer subtyping. Genomics identifies driver mutations, but patients with the same mutations often respond differently to treatment. Transcriptomic profiling reveals that these patients may have different expression subtypes. Proteomic analysis goes further, showing that even within the same expression subtype, protein-level differences (particularly in phosphorylation states) predict treatment response. The Clinical Proteomic Tumor Analysis Consortium (CPTAC) has demonstrated that integrating genomic, transcriptomic, and proteomic data identifies clinically actionable subtypes invisible to any single layer (Cell, 2023).
Drug resistance. A tumor may acquire a resistance mutation detectable by genomics, or it may upregulate a bypass pathway visible in transcriptomics, or it may activate a compensatory signaling cascade visible only through phosphoproteomics. Understanding resistance often requires all three layers.
Rare disease diagnosis. Roughly 50% of patients with suspected genetic diseases remain undiagnosed after exome or genome sequencing. Transcriptomics (RNA-seq from patient tissues) has been shown to increase diagnostic yield by 10-35% in these cases, by revealing splicing defects, allele-specific expression, and expression outliers that genomics alone cannot detect (Nature Medicine, 2023).
Beyond the Big Three: Other Omics Layers
While genomics, transcriptomics, and proteomics are the most established, several additional layers provide complementary information.
Metabolomics
Metabolomics measures the complete set of small molecules (metabolites) in a biological sample. Metabolites are the end products of cellular processes, making metabolomics the closest omics layer to phenotype. It’s particularly valuable in nutrition research, inborn errors of metabolism, and understanding drug metabolism. Key platforms include mass spectrometry and NMR spectroscopy.
Epigenomics
Epigenomics studies chemical modifications to DNA and histone proteins that regulate gene expression without changing the DNA sequence itself. DNA methylation (measured by bisulfite sequencing or methylation arrays), histone modifications (ChIP-seq), and chromatin accessibility (ATAC-seq) provide a layer of regulatory information that sits between genomics and transcriptomics.
Metagenomics
Metagenomics sequences all DNA in an environmental or clinical sample (including microbial communities), revealing the composition and functional potential of microbiomes. The gut microbiome, in particular, is increasingly recognized as a factor in drug response, immune function, and metabolic disease.
Practical Guide: Which Omics to Use When
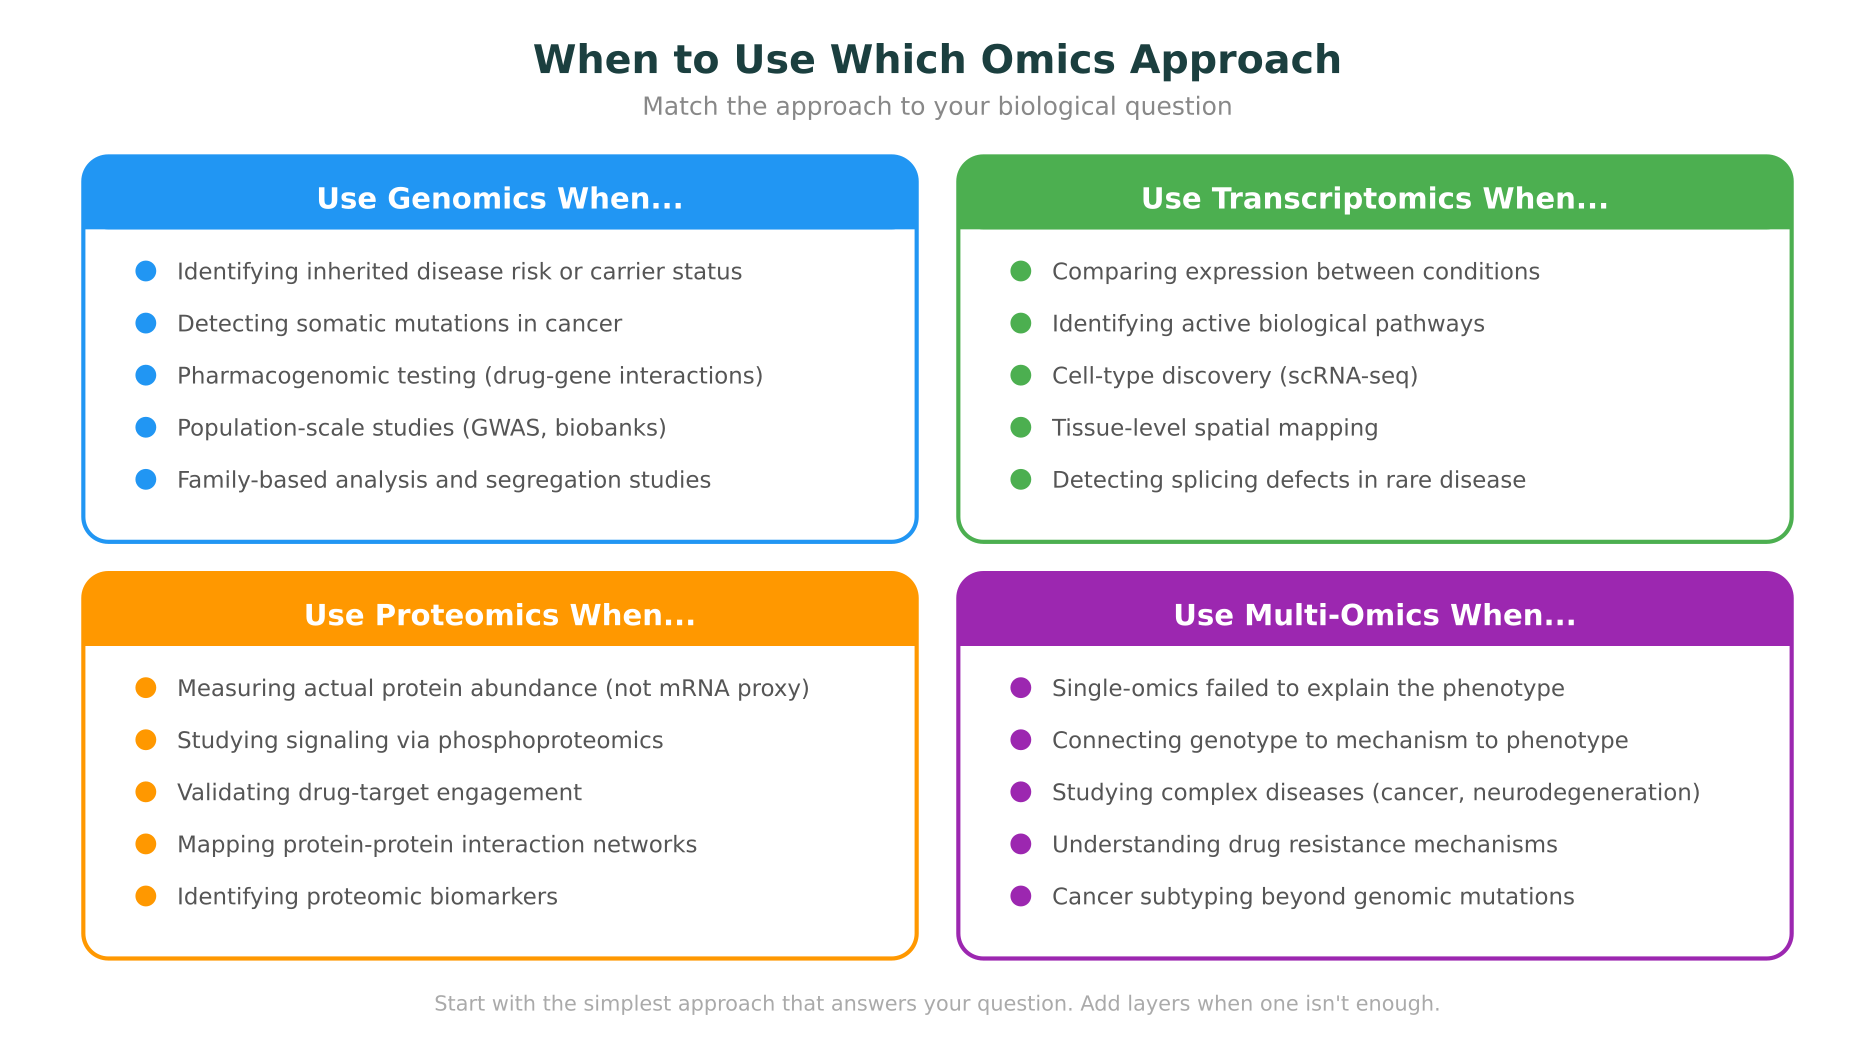
The choice of which omics approach to use depends on the biological question.
Use genomics when:
- You need to identify inherited variants, somatic mutations, or structural variations
- The question is about fixed genetic risk (e.g., disease predisposition, pharmacogenomics)
- You need population-level comparisons or family-based analysis
- Clinical variant interpretation is the goal
Use transcriptomics when:
- You need to compare gene expression between conditions (treatment vs. control, disease vs. healthy)
- Cell-type resolution matters (single-cell RNA-seq)
- Spatial context matters (spatial transcriptomics)
- You want to identify active biological pathways
Use proteomics when:
- You need to measure actual protein levels, not just mRNA proxies
- Post-translational modifications are relevant (signaling, drug response)
- Protein-protein interactions are the question
- Drug-target engagement or off-target effects need validation
Use multi-omics when:
- Single-omics analysis has failed to explain the phenotype
- You need to connect genotype to molecular mechanism to phenotype
- The biological system involves multiple regulatory layers
- You’re working on complex diseases (cancer, neurodegeneration, autoimmune)
How AI Is Changing Multi-Omics Research
The biggest practical barrier to multi-omics research has been integration: getting data from different platforms, with different scales, noise profiles, and batch effects, into a coherent analysis. AI is starting to close this gap.
Recent approaches include end-to-end deep learning models that explicitly model the information flow from DNA to RNA to protein, learning the regulatory rules that connect layers rather than treating each in isolation. Protein language models like ESM-2 and genomic foundation models like AlphaGenome and Evo 2 are providing learned representations that capture biological properties more effectively than hand-engineered features.
For individual researchers, the practical challenge is that multi-omics integration still requires significant computational expertise. Most tools require command-line proficiency, custom scripting, and careful statistical handling of batch effects and missing data. This is where molecular intelligence platforms offer an alternative path. Rather than stitching together separate tools for genomic analysis, protein structure prediction, and database queries, platforms like Purna AI’s MIP bring these capabilities into a single workspace with a natural language interface. A researcher can query across genomic variants, expression data, protein structures, and clinical databases without switching between disconnected tools.
This matters especially for teams that aren’t primarily computational. A wet-lab biologist who generates transcriptomic data shouldn’t need to become a bioinformatics specialist to connect their findings to genomic variants and protein structures. The tools should meet them where they are.
For teams interested in exploring multi-omics analysis on MIP, Purna AI offers research credits of up to $10,000 for qualifying researchers.
The Bigger Picture
Genomics, transcriptomics, and proteomics aren’t competing approaches. They’re complementary layers of biological information, each with distinct strengths and blind spots. The genome tells you what’s possible. The transcriptome tells you what’s happening. The proteome tells you what’s actually working.
The field is moving toward routine multi-omics profiling, where a single experiment generates data across multiple layers and AI helps integrate it into a unified picture. We’re not fully there yet. Data generation costs, integration challenges, and the need for computational expertise remain real barriers. But the trajectory is clear, and the tools for making sense of multi-layered biological data are improving faster than at any point in the history of the field.
Understanding the differences between these omics layers, and knowing when each is most informative, is the foundation for designing experiments that answer the right questions with the right data.
MIP is Purna AI’s Molecular Intelligence Platform, an AI-powered workspace for biology teams. Genomic variant interpretation, protein structure prediction, multi-omics analysis, and 30+ database integrations in one place. Explore the platform at purna.ai. Researchers can apply for up to $10,000 in free credits to run their analyses on MIP.
Explore Purna's Molecular Intelligence Platform
AI-powered workspace for biology teams to accelerate drug discovery from target identification to lead optimization.
Try Purna AI →
