PyMOL vs ChimeraX vs Molstar: Protein Visualization Tools Compared

Protein visualization is not a solved problem. It is a decision that shapes how researchers interact with structural data, what analyses they can run, and how easily they can share results. The three dominant tools in 2026, PyMOL, ChimeraX, and Molstar, each reflect a different philosophy about how molecular graphics should work: desktop power, modern usability, or web-native accessibility. Choosing the best protein visualization tool for your workflow depends on what you need to accomplish and where your work lives.
This comparison covers the practical differences between PyMOL, ChimeraX, and Molstar across rendering, scripting, file format support, large structure handling, and integration with analysis pipelines. Whether you are preparing publication figures, exploring cryo-EM density maps, or embedding a structure viewer in a web application, the right choice depends on your specific use case.
Why Protein Visualization Tool Choice Matters
Structural biology has moved beyond static ribbon diagrams. Modern research requires interactive exploration of protein structures alongside functional annotations, variant data, conservation scores, and stability predictions. The visualization tool you choose determines how smoothly that exploration happens.
A structural biologist studying a protein mutation’s impact on function needs to see the mutation site in context: where it sits relative to the active site, what residues it contacts, whether it disrupts a hydrogen bond network. A drug discovery team needs to visualize ligand binding poses and electrostatic surfaces. A bioinformatician building a web portal needs an embeddable viewer that runs without installation.
No single tool excels at all of these. Understanding the trade-offs is essential for making a practical choice.
PyMOL: The Established Standard
PyMOL has been the most widely used protein visualization tool in structural biology for over two decades. Originally developed by Warren DeLano and now maintained by Schrodinger, it remains the default choice in many academic labs and pharmaceutical companies.
Strengths
Ray-traced rendering. PyMOL’s ray-tracing engine produces publication-quality molecular images that remain the standard in journals like Nature, Science, and Cell. The level of control over lighting, shadows, surface transparency, and depth cueing is unmatched by any other freely available tool. For researchers who need camera-ready figures, PyMOL is often the first choice.
Python scripting. PyMOL exposes its full functionality through a Python API. This makes it possible to automate repetitive tasks: batch-processing hundreds of structures, generating consistent figure sets for a paper, or building custom analysis workflows. The scripting interface has been documented extensively by the community, and there are thousands of PyMOL scripts available online for common tasks.
Extensive plugin ecosystem. Two decades of community development have produced plugins for nearly every niche task: electrostatic surface visualization (APBS), molecular dynamics trajectory viewing, sequence alignment overlays, and pharmacophore display. The PyMOL Wiki contains hundreds of contributed scripts and plugins.
Molecular surface representations. PyMOL handles molecular surfaces, electrostatic surfaces (via APBS integration), and cavity detection well. Surface representations are critical for drug discovery workflows where visualizing binding pockets and surface complementarity is central to the analysis.
Limitations
Steep learning curve. PyMOL’s command-line interface is powerful but intimidating for newcomers. While a GUI exists, most advanced operations require typing commands or writing scripts. Researchers without programming experience often find the initial setup frustrating.
Desktop-only architecture. PyMOL runs as a desktop application on Windows, macOS, and Linux. There is no web-based version, which limits collaboration workflows. Sharing a visualization requires exporting session files or static images, not a URL.
Large structure performance. PyMOL was designed in an era when most structures contained a few thousand atoms. Loading structures with millions of atoms, such as large viral capsids or ribosome assemblies, can cause significant slowdowns. The rendering engine was not built for the scale of structures now routinely determined by cryo-EM.
Licensing complexity. Schrodinger maintains the commercial “incentive” version with additional features and support. The open-source version (available on GitHub) is free but lacks some features and requires building from source on some platforms. This dual-license model can be confusing for new users.
Best for
PyMOL remains the strongest choice for researchers who need publication-quality ray-traced figures, have Python scripting experience, and work primarily with small to medium-sized structures. It is particularly well-suited for structural biology labs that have invested in PyMOL scripts and workflows over many years.
ChimeraX: The Modern Desktop Tool
UCSF ChimeraX, developed at the University of California San Francisco, is the successor to the widely used UCSF Chimera. Released as a ground-up rewrite, ChimeraX modernizes the desktop molecular visualization experience with a contemporary UI, improved performance, and expanded capabilities.
Strengths
Cryo-EM support. ChimeraX was designed with cryo-EM workflows in mind. It handles density maps, segmentation, and model-to-map fitting natively. Tools like “Fit in Map,” volume eraser, and map segmentation are built into the core application. For researchers working with electron microscopy data, ChimeraX offers the most complete desktop solution.
Large assembly handling. ChimeraX’s rendering engine was built to handle large biological assemblies efficiently. It can display multi-million-atom structures like ribosomes and viral capsids with reasonable performance, a significant improvement over Chimera and PyMOL for these use cases.
VR support. ChimeraX includes built-in virtual reality support, allowing researchers to explore protein structures in an immersive 3D environment using standard VR headsets. While VR is not yet mainstream in structural biology workflows, it offers genuine value for understanding spatial relationships in complex assemblies and for educational settings.
Modern user interface. ChimeraX’s interface is cleaner and more intuitive than PyMOL’s. The toolbar provides quick access to common operations, and the command line supports both verbose and abbreviated syntax. Built-in tutorials and a “command history” panel make it easier for new users to learn.
Python API. Like PyMOL, ChimeraX exposes its functionality through Python. The ChimeraX API is well-documented and supports extension development through a plugin (“toolshed”) system. Researchers can write custom tools that integrate directly into the ChimeraX interface.
Limitations
Desktop-only. ChimeraX shares PyMOL’s limitation of being a desktop application. Collaboration requires exchanging session files or screenshots. There is no browser-based version.
Academic license restrictions. ChimeraX is free for academic and non-profit use, but commercial use requires a paid license from UCSF. This is less restrictive than PyMOL’s commercial version but still creates friction for biotech and pharmaceutical users.
Rendering for publication. ChimeraX’s real-time rendering is visually appealing, but its ray-tracing capabilities do not match PyMOL’s for final publication figures. Many researchers use ChimeraX for exploration and analysis, then switch to PyMOL for the final figure.
Smaller community. While ChimeraX adoption is growing, its community is smaller than PyMOL’s. Fewer third-party scripts and tutorials are available, and troubleshooting niche issues can require reaching out to the ChimeraX mailing list directly.
Best for
ChimeraX is the strongest desktop choice for cryo-EM researchers, teams working with large macromolecular assemblies, and users who value a modern interface. It bridges the gap between PyMOL’s scripting power and Molstar’s accessibility, though it remains desktop-bound.
Molstar: The Web-Native Approach
Molstar (Mol*) represents a fundamentally different approach to protein visualization. Developed as an open-source project primarily by the PDBe team at EMBL-EBI and contributors from RCSB PDB, Molstar runs entirely in the web browser. It is the default viewer on the RCSB Protein Data Bank website, the PDBe portal, and a growing number of structural biology web applications.
Strengths
Zero installation. Molstar runs in any modern web browser. There is nothing to download, install, or update. This eliminates the friction that keeps many researchers from exploring protein structures. A colleague can share a Molstar visualization URL, and the recipient sees the same interactive 3D view immediately, on any operating system.
BinaryCIF for large structures. Molstar introduced BinaryCIF, a compressed binary encoding of the mmCIF format that dramatically reduces file sizes and loading times. Structures that would take minutes to load as text-based PDB files open in seconds. This is particularly important for large assemblies like the ribosome or viral capsids, where traditional viewers struggle.
MIT open-source license. Molstar is released under the MIT license, the most permissive common open-source license. Any organization, commercial or academic, can use, modify, and embed Molstar without licensing fees or restrictions. This has driven its adoption as an embedded viewer in dozens of web applications and databases.
Embeddable and extensible. Molstar was designed as a library, not just an application. Developers can embed the Molstar viewer in their own web applications with a few lines of JavaScript. The TypeScript/JavaScript API allows custom extensions, overlays, and data integrations. This is how platforms like RCSB PDB, PDBe, and MIP integrate structural visualization into broader workflows.
Annotation integration. Because Molstar runs in a web context, it can pull annotations, functional data, and variant information dynamically from APIs. On the RCSB PDB website, for example, Molstar displays UniProt annotations, binding site data, and validation metrics overlaid on the structure in real time.
Limitations
Rendering quality ceiling. Molstar uses WebGL for rendering, which provides good real-time performance but cannot match the ray-traced output quality of PyMOL. For final publication figures requiring specific lighting, shadows, and surface rendering, researchers typically still use a desktop tool.
Smaller plugin ecosystem. Compared to PyMOL’s two decades of community contributions, Molstar’s extension ecosystem is younger and smaller. While the core functionality is comprehensive, niche use cases may require custom development.
Offline capabilities. As a web application, Molstar requires an internet connection for most use cases (loading structures from PDB, fetching annotations). While it is possible to run Molstar locally or load local files, the primary workflow assumes connectivity.
JavaScript/TypeScript scripting. Researchers accustomed to Python scripting in PyMOL or ChimeraX need to learn JavaScript or TypeScript to extend Molstar. For biology-focused researchers without web development experience, this can be a barrier to customization.
Best for
Molstar is the strongest choice for web-based workflows, collaborative visualization, platform integration, and any scenario where installation friction is a barrier. It is increasingly the default for researchers who primarily need to explore structures interactively rather than produce ray-traced publication figures.
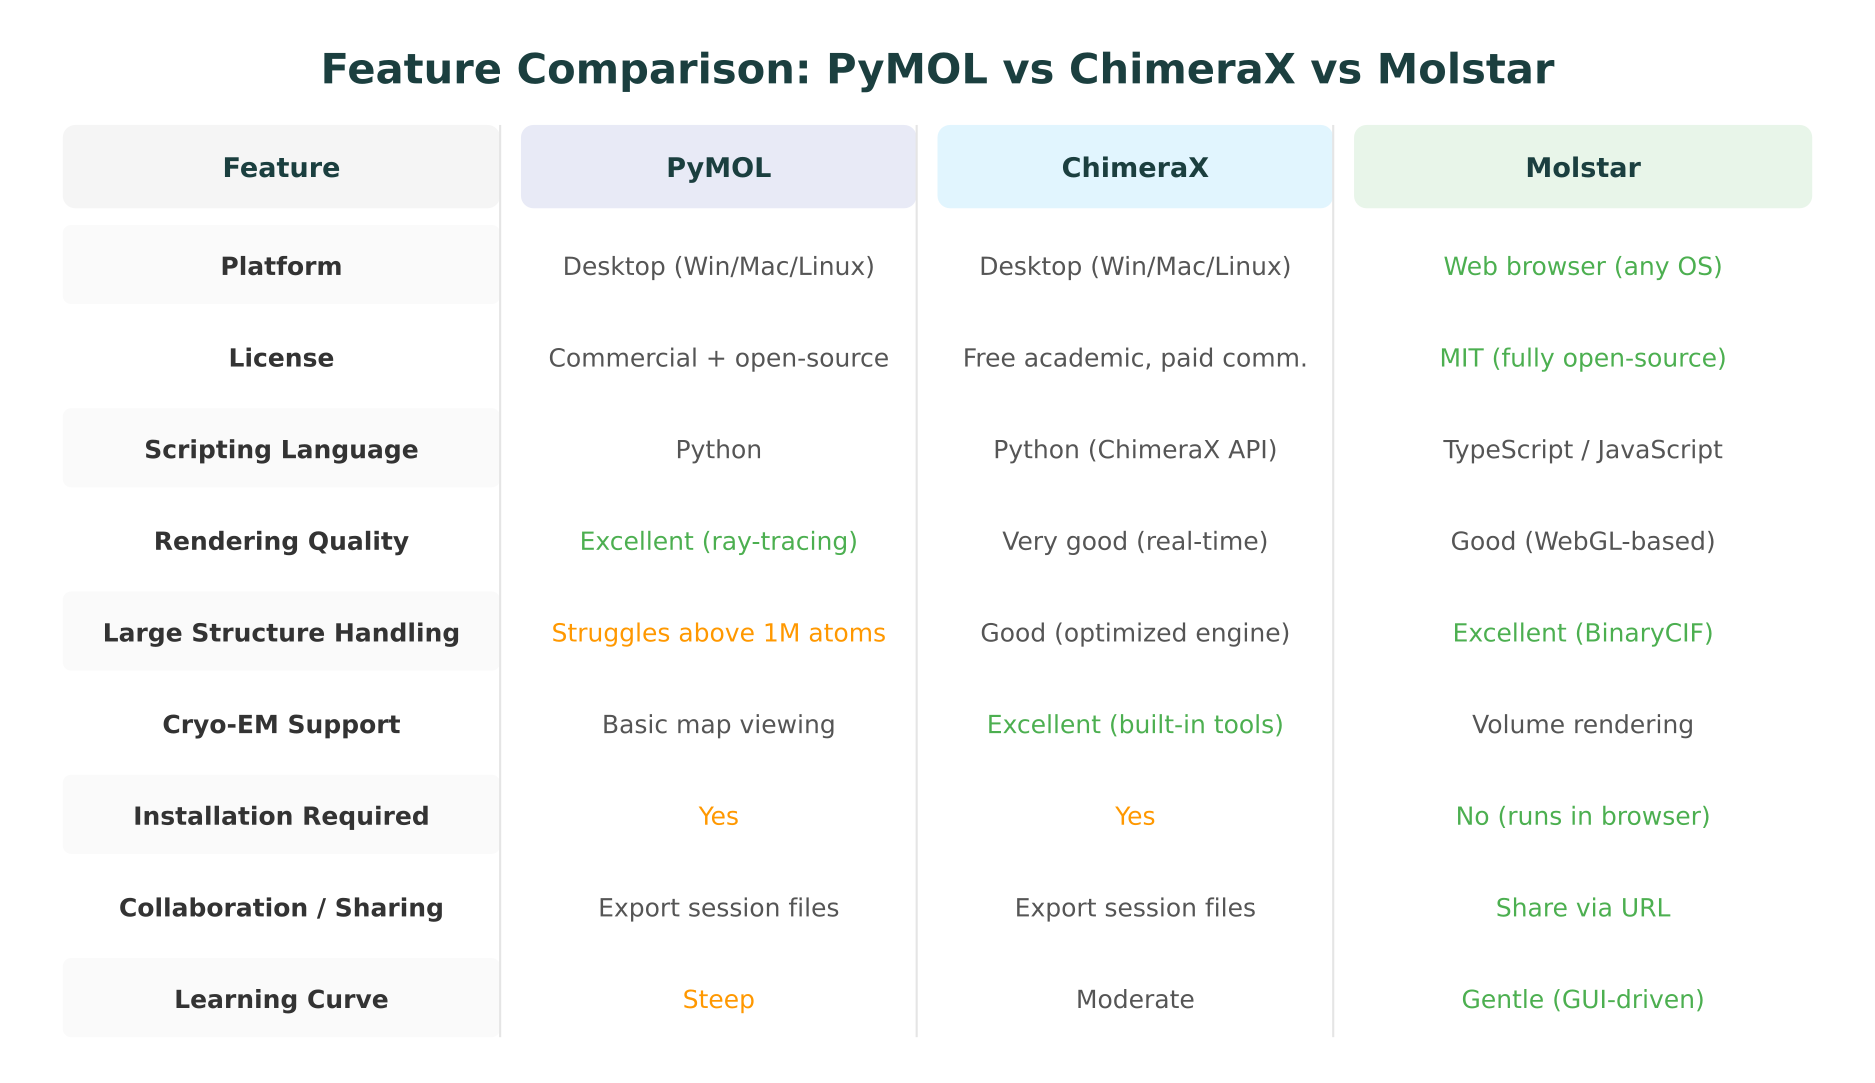
Head-to-Head Comparison
The following table summarizes the key differences across dimensions that matter most for practical tool selection.
| Feature | PyMOL | ChimeraX | Molstar |
|---|---|---|---|
| Platform | Desktop (Win/Mac/Linux) | Desktop (Win/Mac/Linux) | Web browser (any OS) |
| License | Commercial + open-source | Free academic, paid commercial | MIT (fully open-source) |
| Scripting | Python | Python (ChimeraX API) | TypeScript/JavaScript |
| Ray-tracing | Yes (high quality) | Limited | No (WebGL only) |
| Real-time rendering | Good | Very good | Good |
| Large structures | Struggles above ~1M atoms | Good | Excellent (BinaryCIF) |
| Cryo-EM tools | Basic map viewing | Excellent (built-in) | Volume rendering |
| File formats | PDB, mmCIF, SDF, MOL2, many more | PDB, mmCIF, SDF, maps, sequences | PDB, mmCIF, BinaryCIF, SDF, maps |
| Installation | Required | Required | None |
| Collaboration | Session files | Session files | Share via URL |
| VR support | No | Yes (built-in) | No |
| Plugin ecosystem | Very large (20+ years) | Growing | Growing |
| Learning curve | Steep | Moderate | Gentle |
| Primary maintainer | Schrodinger | UCSF | PDBe/RCSB (community) |
When to Use Which: A Practical Decision Guide
Choosing a protein visualization tool is not about finding the “best” option in the abstract. It is about matching the tool to the task.
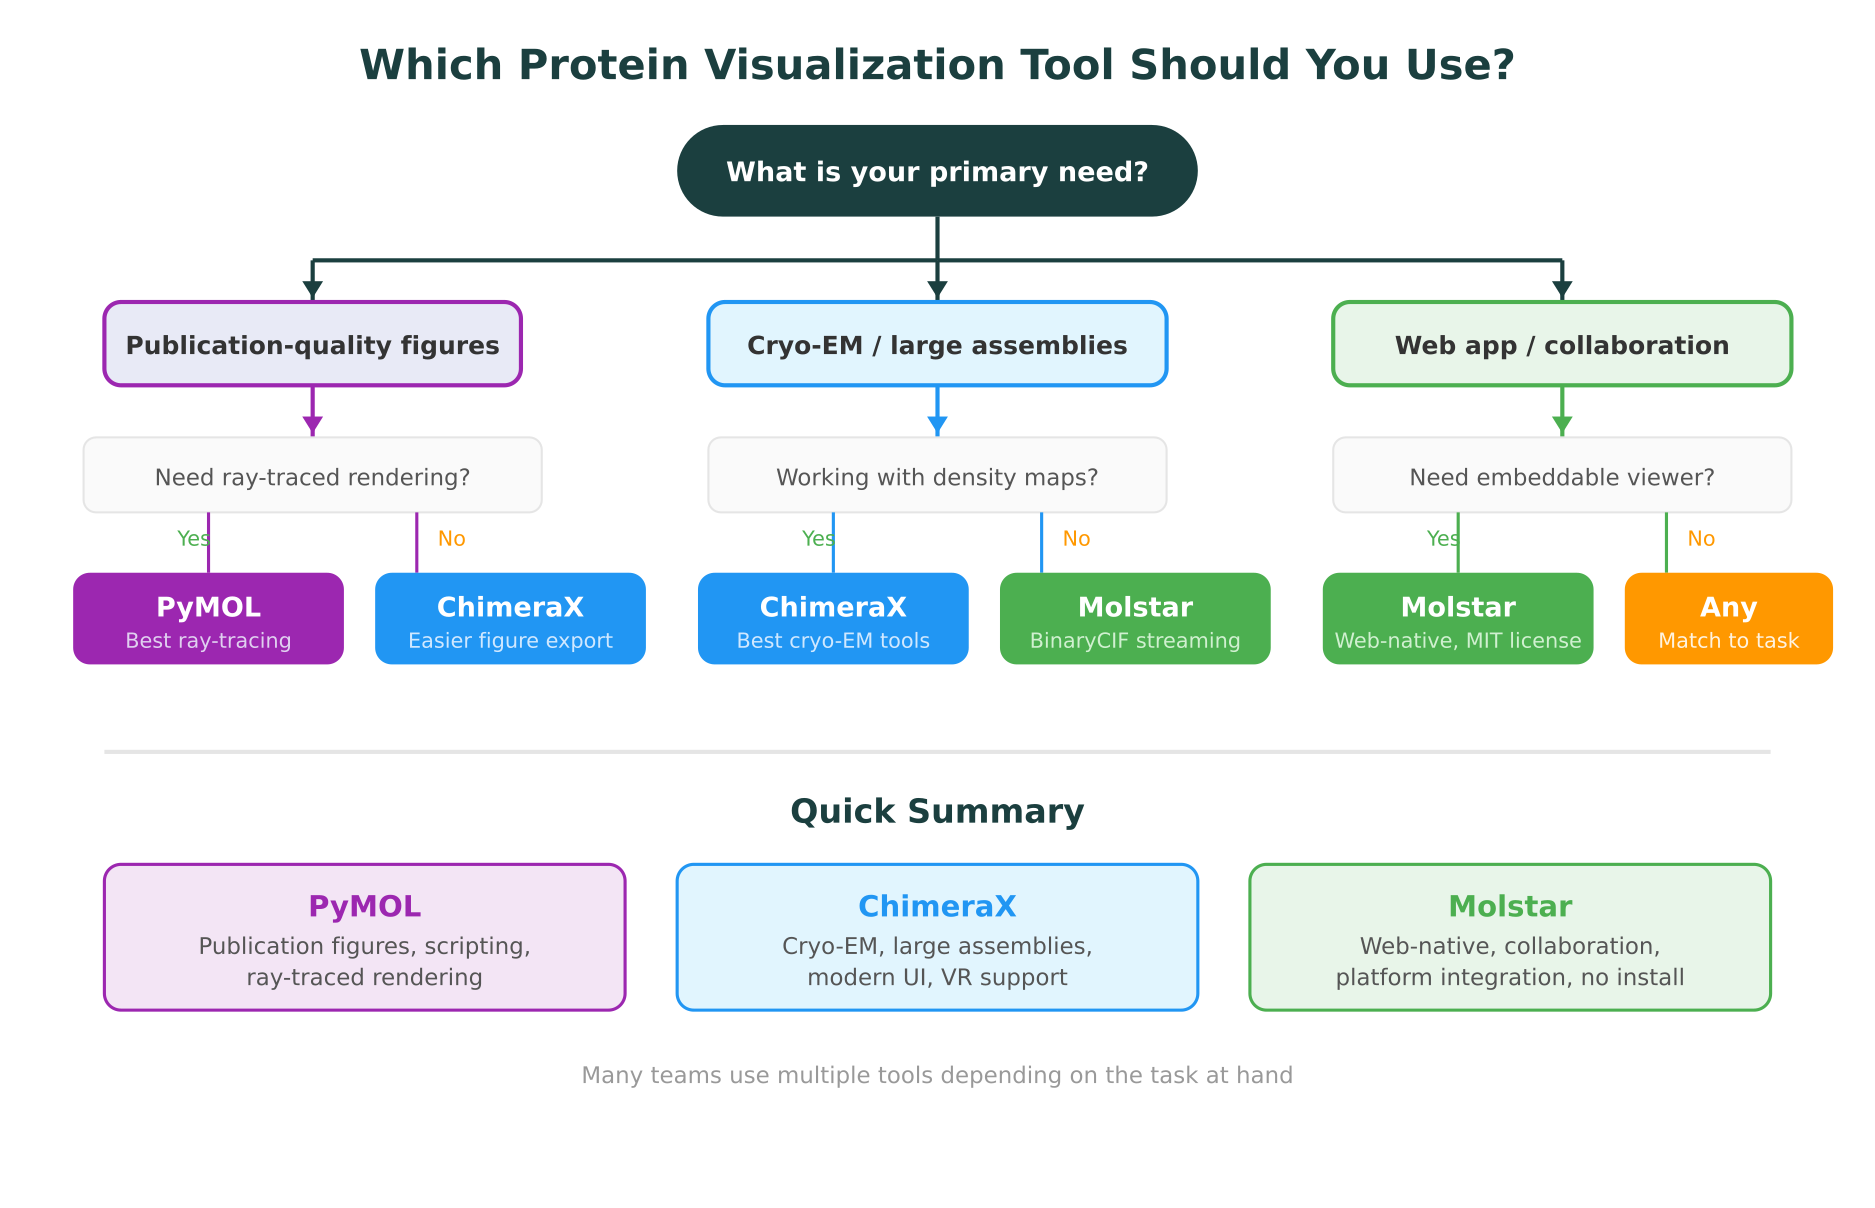
Choose PyMOL when you need:
- Publication-quality ray-traced figures with precise control over lighting, materials, and camera angles
- Automated figure generation via Python scripts (e.g., generating consistent views of 50 mutant structures for a paper)
- Electrostatic surface analysis with APBS integration
- Compatibility with existing lab workflows built around PyMOL scripts and session files
Choose ChimeraX when you need:
- Cryo-EM density map analysis, including map fitting, segmentation, and model building
- Large assembly visualization (ribosomes, viral capsids, chromatin fibers) without performance issues
- VR-based exploration of complex 3D structures
- A modern desktop interface with a gentler learning curve than PyMOL but full desktop power
Choose Molstar when you need:
- Web-based access without requiring anyone to install software
- Embeddable visualization in a web application, database portal, or analysis platform
- Collaborative workflows where sharing a URL is simpler than sharing session files
- Integration with databases and analysis tools in a connected web environment
- Quick structure exploration without the overhead of launching a desktop application
Many researchers use multiple tools
It is common, and practical, to use different tools for different stages of a project. A researcher might explore a structure in Molstar on the RCSB PDB website, analyze cryo-EM density in ChimeraX, and produce final publication figures in PyMOL. The tools are not mutually exclusive.
How Web-Native Visualization Changes Research Workflows
The shift from desktop-only to web-native visualization is more than a technical detail. It changes how structural data fits into the broader research process.
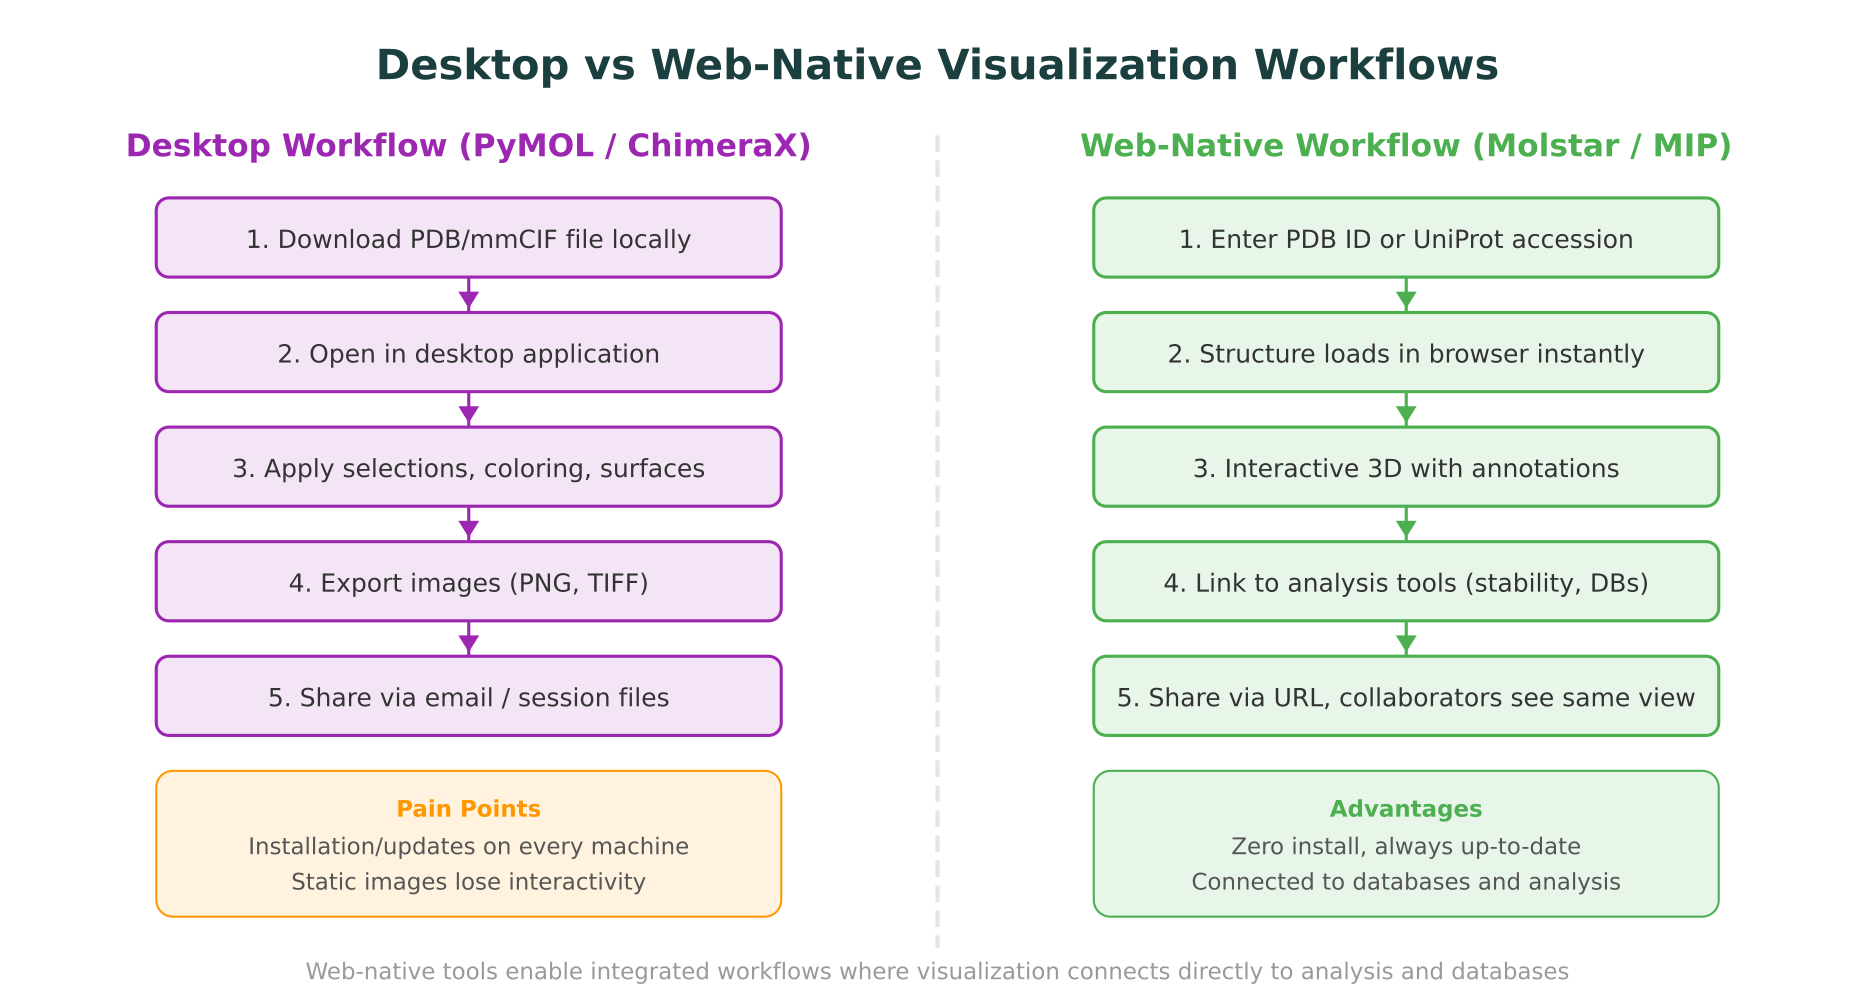
From file passing to integrated workflows
In a traditional desktop workflow, protein visualization exists as an isolated step. You download a PDB file, open it in PyMOL or ChimeraX, look at it, export an image, and move on to the next analysis tool. Each step involves a different application, a different file format, and a manual handoff.
Web-native visualization removes these boundaries. When a viewer like Molstar is embedded in an analysis platform, the structure is not an isolated file but a connected object. Clicking a residue can trigger a database lookup. Highlighting a mutation site can display stability predictions. The visualization becomes an interface to the underlying data, not just a picture of it.
This is the approach that platforms built on molecular intelligence principles are pursuing. Rather than treating visualization as a standalone step, they embed it within a workspace where structure data connects directly to variant annotations, conservation scores, stability analysis, and clinical databases.
Collaboration without friction
Desktop tools require collaborators to have the same software installed, often the same version, and to exchange session files that may not be compatible across operating systems. Web-based visualization eliminates this entirely. A shared URL gives every collaborator the same interactive view, regardless of their operating system or installed software.
For teams working across institutions, or for researchers sharing results with clinicians who do not have PyMOL installed, this is a practical advantage. The ability to share an interactive 3D structure view is fundamentally different from sharing a static screenshot.
Accessibility for non-specialists
Many researchers who would benefit from exploring protein structures never do so because the installation and learning curve of desktop tools is too high. A bioinformatician running a multi-omics analysis may need to quickly check whether a variant falls in a structured domain, but does not want to learn PyMOL to do it. Web-native tools like Molstar lower this barrier to the point where structure exploration becomes practical for researchers who are not structural biologists.
Scripting and Automation Compared
For researchers who need to automate visualization tasks, the scripting capabilities of each tool matter significantly.
PyMOL scripting
PyMOL’s Python API is the most mature. Common automation tasks include:
- Batch rendering of structures with consistent styling
- Generating distance measurements and hydrogen bond networks
- Creating morph animations between conformations
- Automated alignment and superposition of multiple structures
PyMOL scripts can be run from the command line without launching the GUI (using pymol -c), which makes them suitable for pipeline integration on compute clusters. The extensive community documentation means that most common scripting tasks have published solutions.
ChimeraX scripting
ChimeraX supports Python scripting through its chimerax Python package. The API is cleaner and more Pythonic than PyMOL’s, reflecting its more recent design. ChimeraX also supports a command-line syntax that can be used directly in the ChimeraX command prompt or in scripts.
ChimeraX’s scripting is particularly strong for cryo-EM workflows: automating map fitting, running validation, and generating figure panels from density maps. The ChimeraX.core API provides programmatic access to all GUI functionality.
Molstar scripting
Molstar’s TypeScript/JavaScript API is designed for web integration rather than batch processing. Custom Molstar extensions can add new visualization modes, data sources, or UI panels. The API supports:
- Programmatic structure loading and styling
- Custom color schemes and representations
- Dynamic annotation overlays from external APIs
- Integration with React, Angular, or plain HTML/JavaScript applications
For researchers building web tools or platforms, Molstar’s API is the most natural fit. For traditional batch processing tasks, PyMOL or ChimeraX remain more practical.
File Format Support
All three tools support the core structural biology file formats, but with different strengths.
PDB format. The legacy PDB format (flat text, 80-character lines) is supported by all three tools. However, PDB format is officially deprecated by the wwPDB for new depositions due to its limitations with large structures and non-standard entities.
mmCIF/PDBx. The current standard interchange format for macromolecular structures. All three tools support mmCIF, but Molstar’s support is the most comprehensive because its parser was designed around the CIF data model from the beginning.
BinaryCIF. This compressed binary encoding of mmCIF was developed alongside Molstar and is primarily supported by Molstar. It reduces file sizes by 5-10x compared to text mmCIF, which is critical for large structures. PyMOL and ChimeraX do not natively support BinaryCIF.
Density maps. ChimeraX has the strongest support for density map formats (MRC/CCP4, MTZ), including tools for map manipulation, segmentation, and fitting. PyMOL and Molstar can display density maps but with fewer analysis tools.
Molecular formats. PyMOL supports the widest range of small molecule formats (SDF, MOL2, XYZ, etc.), reflecting its long history in drug discovery workflows. ChimeraX and Molstar support the most common formats but may lack niche ones.
How MIP Integrates Protein Visualization
Purna AI’s Molecular Intelligence Platform (MIP) uses Molstar as its embedded structure viewer, chosen specifically because Molstar’s web-native architecture and MIT license allow deep integration into a connected analysis environment.
In MIP, protein visualization is not a standalone step. When a researcher loads a structure, the Molstar viewer connects directly to the platform’s other capabilities. Highlighting a residue shows variant annotations from ClinVar, conservation data from gnomAD, and domain information from UniProt. Running a mutation analysis triggers DynaMut2 stability predictions (delta-delta-G calculations) alongside the 3D visualization, so researchers see how a substitution affects thermodynamic stability in the context of the protein’s structure.
This integration reflects the broader principle of molecular intelligence: connecting data and analysis tools into a single workspace rather than requiring researchers to switch between disconnected applications. For teams that need to move from structure prediction to variant interpretation to clinical database queries, having the visualization embedded in the same environment where those analyses run eliminates the manual handoffs that slow research down.
MIP also supports querying biological databases through natural language, which means a researcher can ask a question like “show me the AlphaFold structure of BRCA1 and highlight all pathogenic variants” and receive an interactive Molstar view with the relevant annotations applied. This is a different model from the traditional workflow of downloading files, opening them in PyMOL, and manually looking up variant data in a separate browser tab.
What the Future Looks Like
Several trends are shaping the protein visualization landscape going forward.
Web-native as default. The RCSB PDB, PDBe, and AlphaFold Database all use Molstar as their default viewer. As more researchers encounter structures through web interfaces first, web-native visualization is becoming the baseline expectation. Desktop tools will remain important for specialized tasks, but the default entry point is shifting to the browser.
Integration over isolation. The value of a visualization tool increasingly depends on what it connects to. A viewer that links directly to variant databases, stability predictors, and analysis pipelines is more useful than one that displays structures in isolation, regardless of rendering quality. This favors web-native tools that can consume and display data from APIs.
AI-assisted exploration. As AI tools become standard in structural biology workflows, the interface between the researcher and the structure is changing. Rather than manually selecting residues and typing commands, researchers are beginning to explore structures through natural language queries that drive both the visualization and the underlying analysis. Platforms implementing molecular intelligence are at the forefront of this shift.
Convergence of capabilities. Molstar’s rendering quality continues to improve with each release, while desktop tools are exploring web-based collaboration features. The gap between the three tools is narrowing in many dimensions, making the choice more about workflow fit than raw capability.
Conclusion
PyMOL, ChimeraX, and Molstar are not interchangeable, and none of them is universally “the best protein visualization tool.” PyMOL remains the gold standard for publication figures and Python-based automation. ChimeraX leads for cryo-EM analysis and large macromolecular assemblies. Molstar is the clear choice for web-based workflows, platform integration, and collaborative visualization.
The most practical approach for many teams is to use multiple tools. Explore structures in Molstar for quick access and sharing. Analyze density maps in ChimeraX for cryo-EM projects. Produce final figures in PyMOL when journal-quality ray-tracing is required.
For researchers who want protein visualization connected directly to variant interpretation, stability analysis, and 30+ clinical database lookups in one workspace, Purna AI’s MIP embeds Molstar within a molecular intelligence environment designed for exactly that workflow. Academic researchers can apply for up to $10,000 in free MIP credits to try it on their own structural data.
Purna AI’s Molecular Intelligence Platform (MIP) is an AI-powered workspace for biology teams. It integrates Molstar-based protein structure visualization with variant interpretation, DynaMut2 stability analysis, and 30+ clinical and biological database connections in one environment. Built for teams who work with structural and genomic data and need connected, reproducible workflows. Learn more at purna.ai.
Explore Purna's Molecular Intelligence Platform
AI-powered workspace for biology teams to accelerate drug discovery from target identification to lead optimization.
Try Purna AI →
