Batch Effects in Omics Data: What They Are and How ComBat/Harmony Actually Fix Them

A major, recurring failure mode in high-throughput genomics is the improper handling of batch effects. In both transcriptomic and proteomic workflows, batch correction is frequently applied as a default, black-box preprocessing step without researchers fully understanding what the underlying algorithms assume about the data. When applied blindly, or when the technical “batch” variable is confounded with true biological conditions, these algorithms can easily erase the genuine biological signals you are trying to study or introduce artificial artifacts into your datasets.
To build reproducible, high-confidence pipelines, computational biologists must move past treating batch correction as a standard checkbox. This article defines the biophysical causes of batch effects in high-throughput datasets, analyzes the mathematical mechanics of the two most commonly used correction methods, ComBat and Harmony, and outlines how to diagnose and prevent over-correction in your analyses.
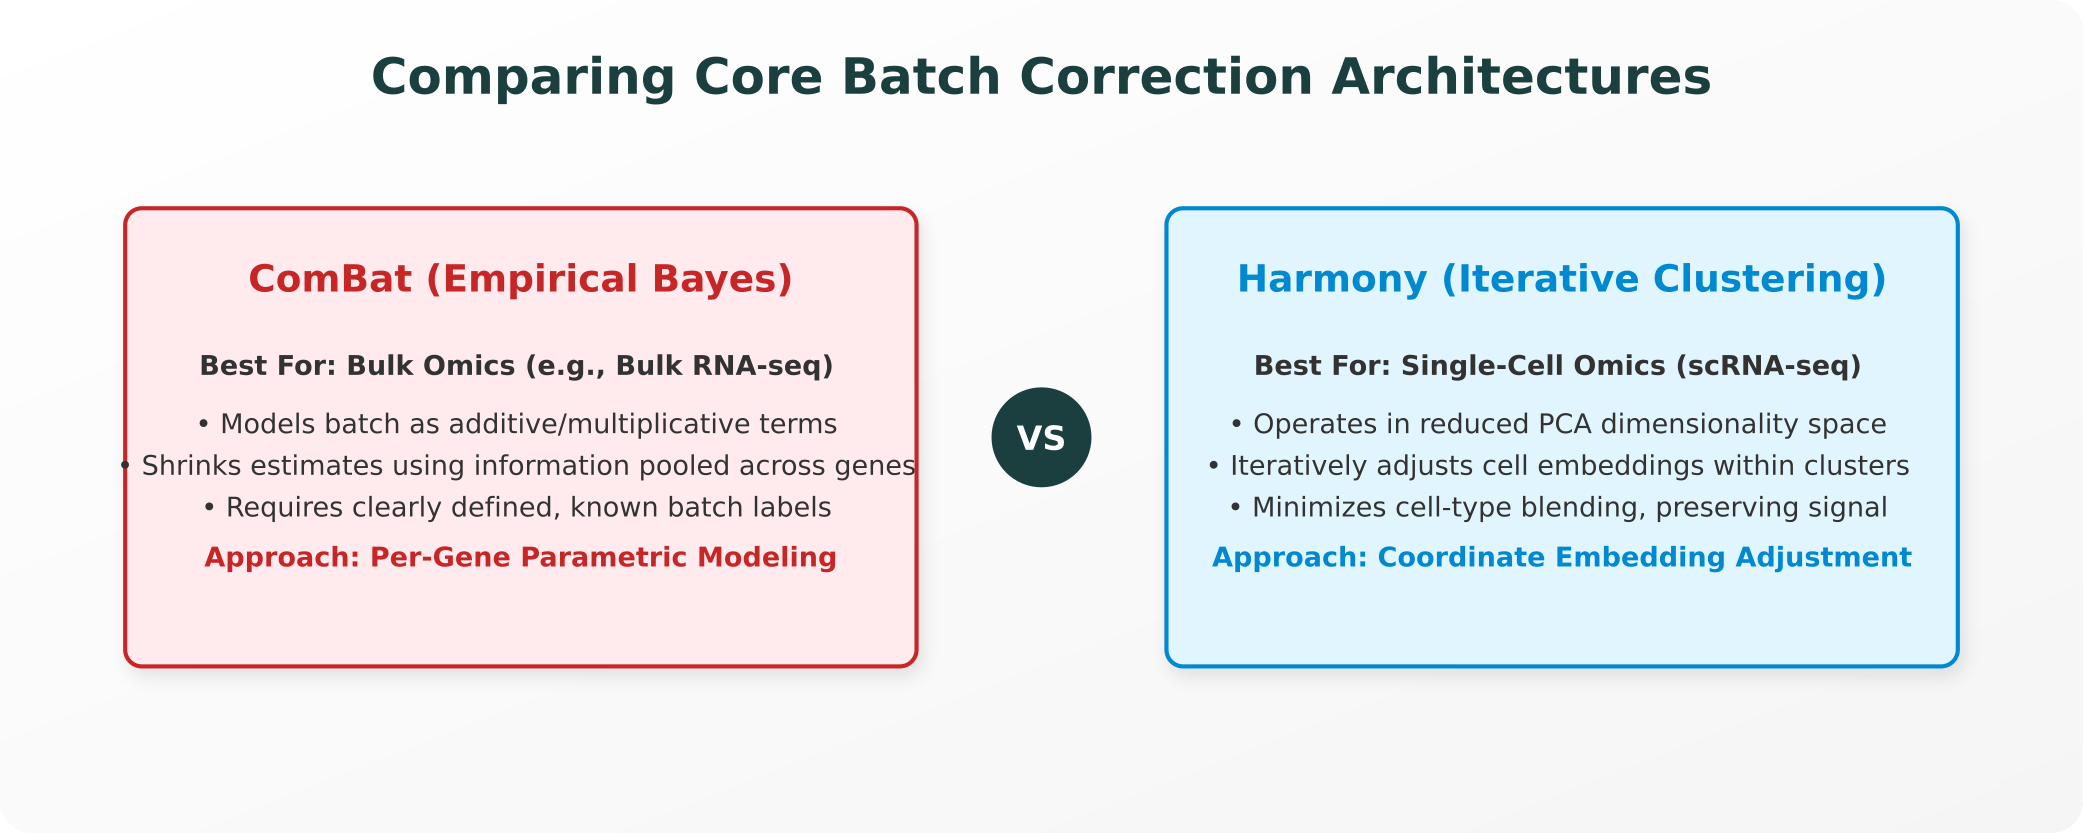
Comparing Core Batch Correction Architectures
Different computational approaches are optimized for different data scales, transitioning from per-gene parametric modeling to iterative coordinate embedding adjustments:
1. What a Batch Effect Actually Is
A batch effect represents systematic, non-biological variation introduced into high-throughput datasets by technical factors. These factors include:
- Using different sequencing runs, flow cells, or instruments.
- Variations in reagent lots or enzyme batches.
- Processing samples on different days, in different locations, or by different technicians.
Because high-throughput instruments are exceptionally sensitive, these technical variables introduce systematic shifts in read counts or signal intensities. On a Principal Component Analysis (PCA) plot, uncorrected batch effects manifest as samples clustering tightly by processing date or sequencer ID rather than by biological condition (such as treated versus control), masking the true biological signal.
2. ComBat: Empirical Bayes for Bulk Datasets
Originally developed for microarray datasets and later extended to bulk RNA-seq preprocessing, ComBat (part of the sva package in Bioconductor) is the standard for bulk omics batch correction.
The Mathematical Mechanics:
ComBat models batch effects as additive (location) and multiplicative (scale) parameters for each individual gene:
- The Model: It fits a linear regression model where the expression of a gene is a function of the biological condition, the additive batch effect, and the multiplicative batch variance.
- Empirical Bayes Shrinkage: The core strength of ComBat is its use of Empirical Bayes (EB) shrinkage. In plain terms, rather than calculating batch correction parameters for each gene in isolation (which can lead to unstable estimates for low-expressed genes), ComBat pools information across all genes in the dataset.
- The Effect: It shrinks the batch parameter estimates toward a common genomic mean. This stabilizing step makes ComBat highly robust, particularly for small-sample bulk studies with clearly defined, known technical batch labels.
3. Harmony: Iterative Cell-Embedding Alignment
As single-cell transcriptomics (scRNA-seq) has scaled, ComBat’s per-gene modeling approach has struggled to scale with thousands of single cells and complex, overlapping technical variables. To address this, Harmony was designed as an iterative, clustering-based algorithm optimized for single-cell data.
The Mathematical Mechanics:
Instead of modeling batch effects as per-gene expression values, Harmony operates in a reduced-dimensionality space (such as PCA space):
- Initial Projection: Harmony maps all cells into a joint Principal Component space.
- Soft Clustering: It groups cells into multi-batch clusters using a soft clustering algorithm, allowing a cell to belong partially to multiple clusters.
- Calculating Centroids: For each cluster, Harmony calculates batch-specific centroids and determines a correction factor to align the different batches.
- Iterative Alignment: It iteratively adjusts the coordinates of individual cell embeddings to maximize batch-mixing within clusters, repeating the process until the cell-embeddings from different batches overlap seamlessly while preserving cell-type-specific biological structures.
By adjusting low-dimensional coordinates rather than individual gene expression values, Harmony single-cell pipelines scale to millions of cells and preserve distinct, cell-type-specific expression profiles.
4. Where the Methods Can Go Wrong
Relying on batch correction tools without reviewing your experimental design introduces severe analytical risks:
- Confounding (The ComBat Failure Mode): If your experimental design is confounded, meaning all control samples were processed in Batch 1 and all treated samples in Batch 2, batch correction is mathematically impossible. Because batch is completely colinear with biology, running ComBat will treat the true biological signal as a technical batch effect and completely erase it, leaving your dataset with zero detectable differential expression.
- Over-Correction (The Harmony Failure Mode): Harmony relies on the assumption that cell types are shared across batches. If your dataset contains a rare, highly specific cell type that only exists in one batch (such as a unique immune cell population present only in the treated cohort), Harmony’s clustering-based mixing can force those cells to align and blend with unrelated cell populations from another batch, silently masking unique cell-state biology.
- Broader Modality Risks: In applications like chromatin accessibility and batch correction (scATAC-seq), technical noise is often highly non-linear, meaning over-correction can easily introduce artificial peaks or distort genomic accessibility profiles if the alignment thresholds are set too aggressively.
5. Responsible Batch Correction Practices
To ensure data integrity, computational biologists should adopt several diagnostic habits:
- Check for Confounding First: Before running any alignment, construct a contingency table crossing your biology variable with your technical batch variable. If the cells show complete colinearity (confounding), stop and redesign the experiment or analyze the batches separately.
- Visualize Before and After: Always generate PCA, t-SNE, or UMAP plots both before and after applying batch correction. Verify that samples from different technical batches overlap, but confirm that distinct biological clusters (such as cell types) remain separate and do not blend into a single, homogeneous blob.
- Verify with Non-Corrected Data: Always run your downstream differential expression or marker gene analysis on both the batch-corrected and the raw (or normalized but uncorrected) datasets. If a highly significant marker gene only appears after batch correction, treat it as a potential artifact until verified.
References and Authoritative Specifications
For researchers seeking to review the primary statistical frameworks and computational packages discussed, the following publications serve as authoritative references:
- The ComBat Specification: Johnson, W. E., Li, C., & Rabinovic, A. (2007). “Adjusting batch effects in microarray expression data using empirical Bayes methods.” Biostatistics, 8(1), 118-127. doi:10.1093/biostatistics/kxj037
- The Harmony Specification: Korsunsky, I. et al. (2019). “Fast, sensitive and accurate integration of single-cell data with Harmony.” Nature Methods, 16(12), 1289-1296. doi:10.1038/s41592-019-0619-0
- The sva Package (Bioconductor): Official documentation and tutorials for bulk batch correction tools. bioconductor.org/packages/sva
- Harmony GitHub Repository: Primary source code and Python/R integration guides for single-cell integration. github.com/immunogenomics/harmony
Explore Purna's Molecular Intelligence Platform
AI-powered workspace for biology teams to accelerate drug discovery from target identification to lead optimization.
Try Purna AI →