
What Makes a Structure Prediction Trustworthy? A Guide to Trust and Evaluation

The revolution in deep-learning-based structural biology has transformed how researchers investigate protein form and function. With the advent of systems capable of generating highly accurate three-dimensional coordinates directly from amino acid sequences, structural models are now integrated into drug discovery, target identification, and protein engineering pipelines globally.
However, the ease with which these models can be generated introduces a significant challenge: how do you assess protein structure prediction accuracy? For any high-stakes downstream application, such as selecting a binding pocket for small-molecule docking or evaluating the functional impact of a somatic mutation, treating a predicted structure as ground-truth without rigorous evaluation is a recipe for experimental failure.
This article establishes a rigorous, evidence-grounded framework for evaluating structure prediction confidence, detailing the mathematical metrics biologists use to assess reliability, identifying where prediction models typically fail, and providing a practical checklist for deciding when to trust an AI-generated protein structure.
1. The Tool Landscape at a High Level
Before evaluating trustworthiness, it is useful to briefly map the current algorithmic landscape. While several architectures exist, they utilize distinct input layers and optimization strategies:
- AlphaFold2: The landmark deep-learning model that coupled multiple sequence alignments (MSAs) with an attention-based Evoformer network to achieve near-experimental accuracy for single-chain proteins.
- AlphaFold3: An evolution that replaces the 3D-refinement networks of AlphaFold2 with a diffusion module, expanding prediction capabilities beyond proteins to include nucleic acids (DNA/RNA), chemical ligands, ions, and post-translational modifications.
- ESMFold: A language-model-based predictor that bypasses the computational bottleneck of searching and building MSAs, instead utilizing representation vectors from the ESM-2 protein language model to achieve rapid, single-sequence fold predictions.
- Boltz-2: An open-source, highly efficient structure predictor designed to model complex multi-chain macromolecular complexes and biochemical ligands with a focus on high-throughput accessibility.
- RoseTTAFold: A three-track neural network that simultaneously processes sequence, distance, and 3D coordinate data, offering strong capabilities in modeling both proteins and protein-nucleic acid complexes.
While each tool has distinct computational and biochemical advantages, they all share a common need: their outputs must be critically evaluated before they are trusted.
2. Confidence Metrics: How Biologists Assess Reliability
Rather than simply producing 3D coordinates, modern structure prediction systems output highly calibrated per-atom and global confidence metrics. Understanding the mathematical definitions and biological interpretations of these metrics is the first step in learning how to trust AI protein structures.
pLDDT (Predicted Local Distance Difference Test)
The primary metric for assessing local, per-residue structure confidence is pLDDT, which ranges on a scale from 0 to 100. Technically, pLDDT estimates how closely the predicted local C-alpha distances match the true, physical structure.
- High-Confidence (Score > 90): These regions have highly reliable local backbone conformations. Side-chain coordinates in these areas are typically accurate enough to justify active-site identification and molecular docking simulations.
- Moderate-Confidence (70 to 90): The overall secondary structure fold is reliable, though minor backbone details and side-chain orientations may deviate from the physical ground-truth.
- Low-Confidence (Score < 50): Local backbone coordinates in these regions are highly unreliable.
The Critical Nuance: A common, costly misunderstanding among researchers is treating low pLDDT scores as a failed prediction. In many cases, low pLDDT regions (especially longer stretches) correspond to intrinsically disordered regions (IDRs). These segments do not possess a single, stable 3D conformation in isolation, but are instead physically flexible and dynamic in vivo. In this sense, a low pLDDT score is often a highly accurate prediction of physical flexibility rather than an algorithmic failure.
PAE (Predicted Aligned Error)
While pLDDT evaluates local confidence, it is completely insufficient for judging multi-domain or multi-chain structures. To evaluate the relative positions and orientations of distinct domains or interacting chains, biologists use the Predicted Aligned Error (PAE) matrix.
PAE measures the estimated distance error (in Angstroms) at residue $x$ when the predicted structure is aligned at residue $y$. When visualizing a PAE plot:
- Low PAE (Dark Green / Low Error): Indicates that the relative position of the two domains or chains is predicted with high confidence.
- High PAE (Light / High Error): Indicates that while individual domains may have high local confidence (high pLDDT), their relative orientation or packing interface is highly uncertain.
pTM and ipTM (Predicted TM-score)
To evaluate the overall global fold of a protein or complex, models calculate the predicted Template Modeling score (pTM) and interface Template Modeling score (ipTM). Ranging from 0 to 1, a global pTM score above 0.5 indicates that the predicted global fold shares the same topological architecture as the true structure, while scores below 0.5 indicate a likely incorrect overall topology.
Summary of Key Confidence Metrics
The following comparison table summarizes the primary metrics, what they measure, and how researchers should interpret their scores:
| Confidence Metric | Scope | Target Measurement | High Score Interpretation | Low Score Interpretation |
|---|---|---|---|---|
| pLDDT | Per-residue | Local backbone conformation and C-alpha distance accuracy. | Highly reliable local fold; suitable for active-site mapping. | Unreliable local coordinates; often indicates intrinsically disordered or flexible regions. |
| PAE | Pairwise (residue-to-residue) | Relative distance error between two residues when aligned. | Trustworthy relative orientation between domains or interacting chains. | Uncertain inter-domain packing; relative orientation of domains is likely incorrect. |
| pTM / ipTM | Global structure / Interface | Overall structural topology and interface alignment quality. | Correct overall fold topology; reliable interface interactions. | Incorrect global fold; failed interface prediction. |
3. Blind Benchmarks and Gold Standards: CASP and Cross-Validation
To independently verify these metrics, the structural biology community relies on two primary validation pillars: double-blind competitions and direct experimental cross-validation.
The CASP Benchmark
The standard for evaluating structure prediction accuracy is the Critical Assessment of Structure Prediction (CASP) experiment, a community-wide blind-testing competition held every two years. In CASP, prediction groups are given amino acid sequences for proteins whose structures have been experimentally determined but not yet published.
Findings from the recent CASP16 (2024-2025 round) provide a clear snapshot of where the boundaries of structure prediction currently lie:
- Solved Domains: Single-domain fold prediction is now considered largely a solved problem, with models consistently achieving experimental-grade accuracy for single-chain globular proteins.
- The Difficult Frontier: Multi-domain architectures, complex protein-protein interfaces, shallow multiple sequence alignments (where few evolutionary homologs exist), and large eukaryotic or viral proteins remain genuinely difficult. The consensus from CASP16 is that while local confidence is high, predicting the dynamic, multi-state assemblies of complex networks is still an active research challenge.
Experimental Cross-Validation
No computational model, regardless of its confidence scores, is completely verified without direct comparison to experimental data when available. The gold standards for cross-validation include:
- X-ray Crystallography: Provides high-resolution atomic coordinates, ideal for validating side-chain packing in active sites.
- Cryo-Electron Microscopy (Cryo-EM): Ideal for validating large macromolecular complexes, flexible assemblies, and multi-protein interfaces.
- Nuclear Magnetic Resonance (NMR): Particularly useful for validating the dynamic ensemble states of intrinsically disordered or flexible regions identified by low pLDDT scores.
4. Where Structure Predictions Generally Go Wrong
Even top-tier models can fail in predictable, well-documented ways. Understanding these failure modes is essential for maintaining a healthy skepticism when using computational models.
(a) Shallow and Noisy MSA Targets
Structure prediction models rely heavily on evolutionary information. By aligning homologous sequences in a Multiple Sequence Alignment (MSA), the model identifies co-varying residues (covariation), which physically suggest that those residues are in close spatial contact in the folded protein.
- The Failure Mode: If a target protein is novel, highly engineered, or belongs to an understudied organism with few evolutionary relatives, the MSA is “shallow” or “noisy.” Without sufficient covariation signals, prediction quality drops precipitously, often leading to incorrect topological folds despite moderate local confidence scores.
(b) The Multi-Domain Orientation Problem
A protein can consist of multiple highly stable domains connected by a flexible linker.
- The Failure Mode: The model may predict each individual domain with near-perfect local accuracy (pLDDT > 90). However, because the linker is flexible in solution, the model’s prediction of the relative orientation of those domains has very low confidence. This is precisely what the PAE matrix is designed to catch: if you see solid blocks of green along the diagonal of a PAE plot but white space between those blocks, you cannot trust how those domains are packed together.
(c) The Model-Ranking Problem
When generating predictions, systems typically output multiple candidate structures (usually five models), which are ranked based on their predicted confidence scores.
- The Failure Mode: A distinct and under-discussed failure mode is that confidence metrics do not always successfully identify which candidate model is actually the correct one. In some cases, a system will generate a highly accurate model as Model 4, but rank a less accurate structure as Model 1 due to subtle errors in the scoring function. Biologists must look across all generated models rather than blindly accepting the top-ranked output.
(d) The Misinterpretation of Low pLDDT
Treating a low pLDDT score as a failure is a frequent mistake. If a researcher discards a model simply because a loop or terminal tail has a pLDDT score of 40, they may be missing critical biological reality: that region is meant to be flexible to facilitate ligand binding or protein-protein interactions.
5. Trust Decision Logic
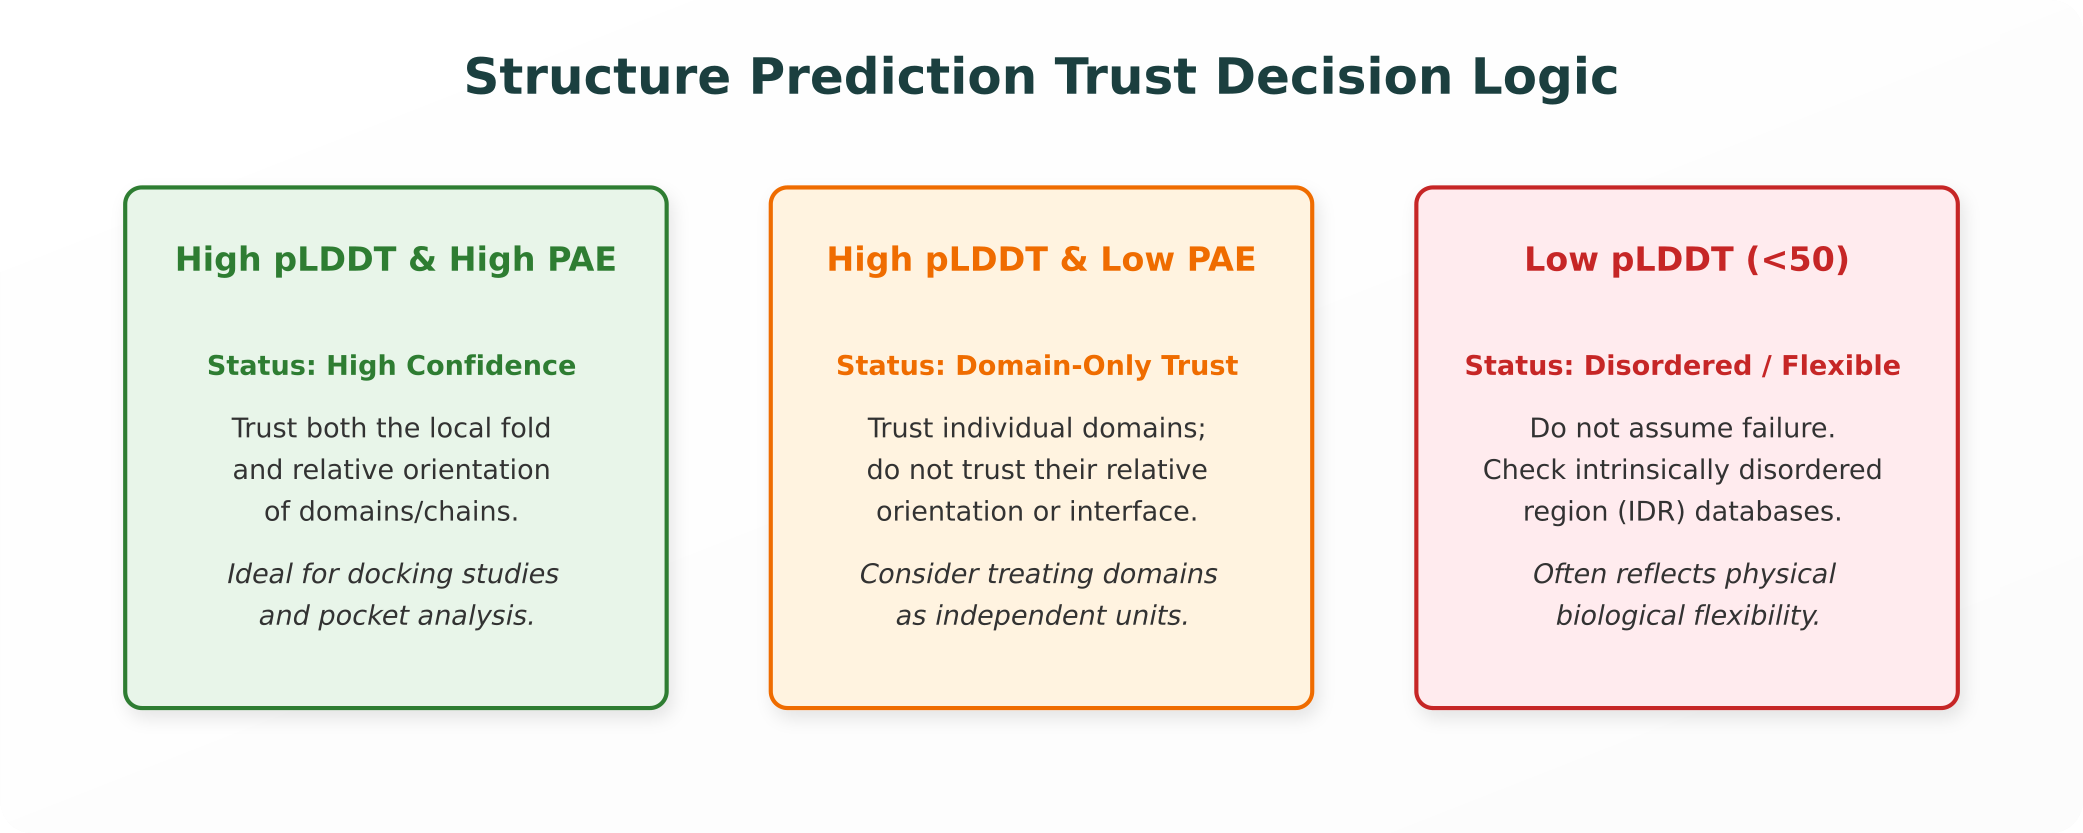
To help researchers navigate these metrics and make confident, objective trust decisions, we can map the evaluation process into a structured decision logic, as shown in the following diagram:
This logic guides the evaluation of any structure:
- Analyze pLDDT first: If per-residue confidence is low across a broad segment, consult disordered region databases (like MobiDB) before assuming the prediction failed.
- Analyze PAE next: If pLDDT is high, check the PAE matrix. If inter-domain PAE is high, trust each domain as an isolated unit but do not trust the overall packed structure or interface.
- Trust the full fold: Only when both local (pLDDT) and relative (PAE) confidence are high can you trust the complete multi-domain or complex fold.
6. Practical Takeaway Checklist for Researchers
Before integrating any predicted structure into your experimental designs or grant proposals, execute this simple, rigorous evaluation checklist:
- Check pLDDT and PAE Together: Never evaluate a multi-domain protein or complex using pLDDT alone. Ensure that inter-domain or inter-chain PAE scores are low (ideally representing a low estimated PAE error) before trusting the relative orientation.
- Assess MSA Depth: Look at the number of sequences in your Multiple Sequence Alignment. If the target has a shallow MSA with relatively few homologous sequences, treat the predicted structure with extreme caution, regardless of the reported confidence scores.
- Look Across All Generated Models: Do not limit your analysis to the top-ranked model. Inspect all five generated candidates, looking for structural consistency or alternative conformations that might reflect real biological states.
- Validate Against Experimental Controls: If high-resolution experimental structures (X-ray, Cryo-EM) exist for close homologs, align them to your prediction. Check if key structural features, such as disulfide bonds or active-site geometries, are physically conserved.
- State Uncertainty Honestly: When publishing or presenting predicted structures, clearly state the reported pLDDT, PAE, and pTM scores. Highlight areas of uncertainty, and explicitly note if low-confidence regions correspond to predicted intrinsically disordered segments.
Accelerating Trust with Molecular Intelligence
Evaluating structure predictions manually requires jumping between terminal windows, visualization packages (like PyMOL or ChimeraX), and database browser tabs.
Purna AI’s Molecular Intelligence Platform (MIP) is designed to eliminate this fragmented workflow. Built specifically as an IDE and biology workspace for R&D teams, Purna integrates structural visualization, confidence analysis, and biological reference databases into a single, cohesive environment:
- Integrated 3D Structural Analysis: Purna renders interactive 3D structures natively in your workspace using Molstar. You can instantly color models by their pLDDT scores, making low-confidence loops and high-confidence active sites visible in seconds.
- Automated Database Cross-Referencing: When you inspect a target, Purna automatically queries ClinVar, gnomAD, and UniProt in real-time, mapping known clinical variants and functional domains directly onto the 3D model, allowing you to validate structural predictions against real-world clinical outcomes.
- Seamless Multi-Model Comparisons: Purna simplifies the model-ranking problem. You can visualize, overlay, and compare all five candidate predictions simultaneously, running biophysical stability and binding calculations to confidently identify the most biologically relevant conformation.
By combining advanced text-mining with rigid, physical structural validation, Purna AI transforms speculative structural models into precise, evidence-backed molecular intelligence, helping research teams validate targets and design experiments with complete scientific integrity.
Explore Purna's Molecular Intelligence Platform
AI-powered workspace for biology teams to accelerate drug discovery from target identification to lead optimization.
Try Purna AI →