From Sequence to Structure to Function: How AI Connects the Dots in Biology

Biology has always been a discipline of layers. You sequence a gene to find a variant. You predict a protein’s structure to understand its shape. You assess that structure’s function to figure out what it does. And then you try to connect all of those findings to a clinical or research question.
The problem is that each of these layers has historically lived in a different tool, a different database, and often a different team’s expertise. The researcher who calls variants in GATK is not always the same person who visualizes protein structures in PyMOL or runs stability predictions in DynaMut2. The clinician who reviews an ACMG classification may never see the structural evidence that informed it. Information gets lost at every handoff.
This post traces the full biological analysis pipeline, from raw sequence to functional and clinical interpretation, and examines how AI is turning what used to be a fragmented, multi-day process into a connected workflow.
The Traditional Workflow: Four Steps, Eight Tools, Three Days
Before we look at how AI changes things, it is worth understanding what the traditional workflow actually looks like. Consider a clinical geneticist trying to interpret a novel missense variant found in a patient with a suspected genetic condition.
Step 1 involves sequencing and variant calling. Raw reads get aligned to a reference genome, variants are called using tools like GATK or DeepVariant, and the output is a VCF file with thousands of variants that need filtering and prioritization.
Step 2 is annotation and database lookup. The geneticist cross-references the variant against ClinVar, gnomAD, OMIM, and other databases to check whether it has been previously reported, how common it is in the population, and whether the gene is associated with the patient’s phenotype.
Step 3 requires structural analysis. If the variant is in a protein-coding region, someone needs to pull up the protein structure (from PDB or AlphaFold), visualize it, check where the affected residue sits in the 3D structure, and run stability predictions to estimate whether the amino acid change disrupts folding.
Step 4 brings clinical classification. All of the evidence from the previous steps needs to be synthesized into an ACMG/AMP classification, which determines whether the variant is pathogenic, likely pathogenic, a variant of uncertain significance (VUS), likely benign, or benign.
Each step typically requires a different piece of software, a different database, and sometimes a different person. The entire process can take days for a single variant, and the context accumulated in one step does not automatically carry over to the next.
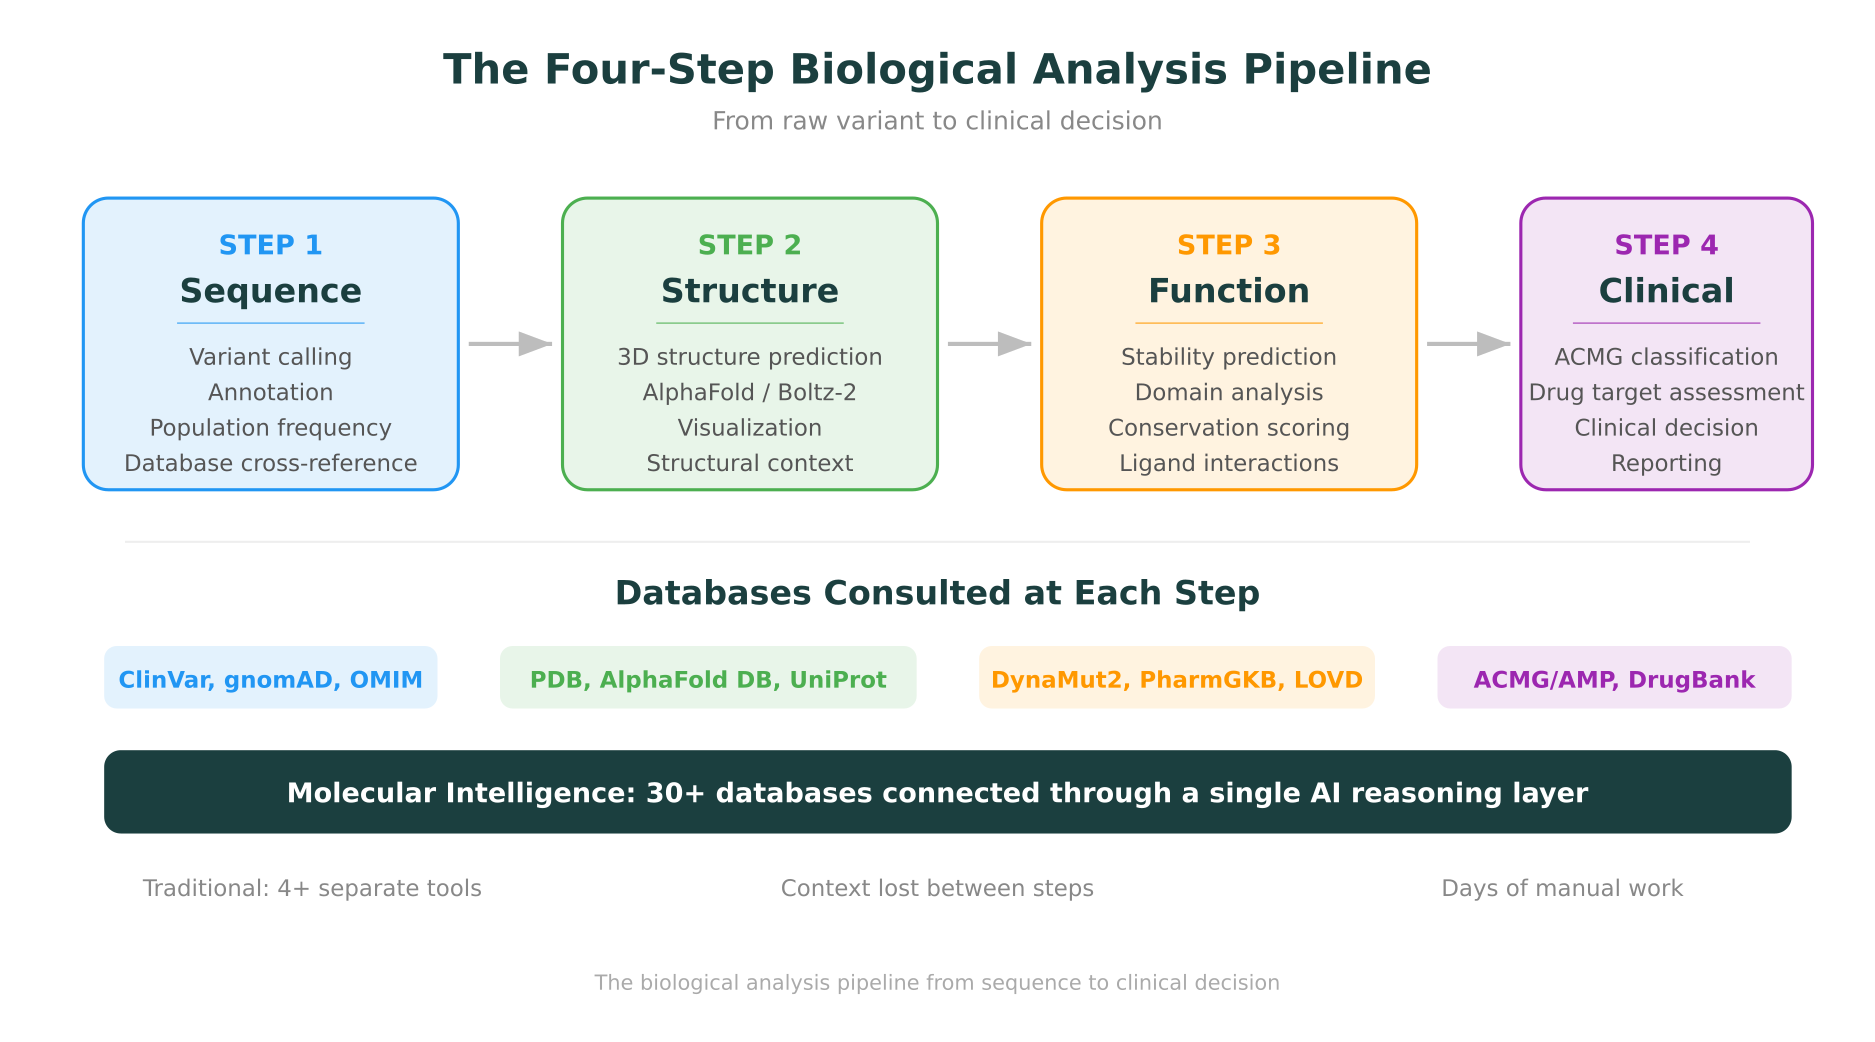
This is the gap that molecular intelligence is designed to close: not by replacing any individual tool, but by connecting them into a continuous reasoning chain where evidence flows from one step to the next without manual re-entry.
Step 1: Sequence. Finding the Variant in the Noise.
The sequencing step has been transformed by AI in the past three years, though not in the way most people expected. Sequencing itself was already fast and cheap. The bottleneck was always interpretation.
Variant calling and annotation
Modern AI-based variant callers like DeepVariant use deep learning to distinguish true variants from sequencing artifacts, achieving accuracy that matches or exceeds traditional statistical methods. But calling the variant is just the beginning. A typical whole-exome sequencing run produces 20,000 to 30,000 variants. The real work is figuring out which ones matter.
This is where database integration becomes critical. A variant’s significance depends heavily on its population frequency (is it common or rare?), its presence in disease databases (has it been linked to a condition before?), and its predicted effect on the protein (does it change a critical amino acid?). Tools like ClinVar, gnomAD, and OMIM each hold a piece of this puzzle.
For researchers new to interpreting sequencing results, understanding how to read a genomic report is an essential foundation. The challenge is that most genomic reports summarize findings from many of these databases, but the synthesis is often done manually.
The VUS problem
A significant proportion of variants identified in clinical sequencing, often more than 40%, are classified as variants of uncertain significance (VUS). These are variants where the existing evidence is insufficient to classify them as either pathogenic or benign. Resolving a VUS requires pulling in additional lines of evidence, and this is exactly where the traditional fragmented workflow breaks down.
If the only tool you have is a database browser, and the variant is not in the database, you are stuck. Moving past a VUS classification requires going deeper: checking the protein structure, running stability predictions, analyzing conservation, and evaluating functional domain proximity. This is the transition from Step 1 to Step 2.
Step 2: Structure. From Letters to 3D.
The protein structure prediction revolution, triggered by AlphaFold and accelerated by tools like Boltz-2 and ESMFold, has fundamentally changed what is possible in Step 2 of the analysis pipeline.
What structure prediction gives you
Before AlphaFold, getting a protein’s 3D structure required experimental determination via X-ray crystallography, cryo-EM, or NMR spectroscopy. These methods are accurate but slow and expensive. Many clinically relevant proteins had no experimentally determined structure.
Now, predicted structures are available for nearly every human protein through the AlphaFold Protein Structure Database. For a researcher investigating a novel variant, this means they can immediately see where the affected residue sits in the protein’s 3D architecture: is it on the surface or buried in the core? Is it in a functional domain or a flexible loop? Is it near a binding site?
These spatial questions cannot be answered from the sequence alone. They require the structural layer.
Visualization matters
Having a predicted structure is only useful if you can see it and interact with it. The choice of molecular visualization tool, whether PyMOL, ChimeraX, or Molstar, shapes what insights a researcher can extract.
Molstar, in particular, has gained traction for integrated workflows because it runs in a web browser, renders both experimental and predicted structures, and can highlight specific residues, domains, and annotations without requiring local software installation. For platforms that aim to connect sequence analysis with structural analysis, browser-based visualization eliminates one of the traditional handoff points.
Generative structure methods
The field continues to advance beyond static structure prediction. Generative AI approaches to protein folding are now producing not just single snapshots of a protein’s most likely conformation, but ensembles of conformations that capture the protein’s dynamic behavior. This matters because many mutations affect protein function not by destroying the static structure, but by altering the protein’s flexibility, dynamics, or conformational transitions.
Step 3: Function. What Does the Mutation Actually Do?
Having a variant’s location in 3D space opens the door to functional assessment. This is where the analysis moves from “where is this mutation?” to “what does it do?”
Stability prediction
The most direct functional question is whether the mutation destabilizes the protein. Tools like DynaMut2 estimate the change in thermodynamic stability (delta-delta-G) caused by a point mutation. A strongly destabilizing mutation (negative delta-delta-G, typically below -1.0 kcal/mol) suggests the protein’s fold is compromised, which usually means loss of function.
Predicting the impact of protein mutations has moved from rough estimates based on amino acid similarity matrices to physics-informed models that account for the specific structural context of each residue. The accuracy of these predictions depends heavily on the quality of the input structure, which is why the sequence-to-structure-to-function pipeline needs to be connected rather than fragmented.
Domain and conservation analysis
Beyond stability, functional impact depends on the biological role of the affected region. A mutation in a catalytic active site is more likely to be damaging than one in a disordered loop. Conservation analysis, which compares the residue across species, provides another layer: positions that are conserved across mammals or vertebrates are likely under selective pressure because they are functionally important.
These analyses require pulling data from multiple sources: UniProt for domain annotations, phylogenetic databases for conservation scores, and structural databases for active site and binding site information. In a fragmented workflow, each of these is a separate lookup. In a connected workflow, the AI reasoning layer synthesizes them together.
Protein-ligand interactions
For variants near binding sites, the question extends to whether the mutation affects how the protein interacts with its partners. Protein-ligand docking can model these interactions computationally, testing whether a mutation changes binding affinity, geometry, or specificity.
This is particularly relevant for drug discovery applications, where a mutation in a drug target protein might render a therapeutic compound ineffective. Connecting structural analysis directly to docking simulations shortens the path from “this variant affects protein structure” to “this variant affects drug binding.”
Step 4: Clinical and Translational. From Evidence to Decision.
The final step takes all of the evidence gathered in Steps 1 through 3 and translates it into a classification or recommendation.
ACMG/AMP classification
The American College of Medical Genetics and Genomics (ACMG) framework provides a standardized system for variant classification. It defines 28 criteria, each weighted as strong, moderate, or supporting evidence, that combine to produce one of five classifications: pathogenic, likely pathogenic, VUS, likely benign, or benign.
Applying the ACMG framework well requires synthesizing evidence from across the entire pipeline:
- Population data (Step 1): Is the variant absent from population databases? (PM2)
- Computational predictions (Steps 2-3): Do multiple computational tools predict a damaging effect? (PP3)
- Functional domain (Step 3): Is the variant in a critical functional domain? (PM1)
- Gene-level constraints (Step 1): Is the gene intolerant to missense variation? (PP2)
The challenge is that in a fragmented workflow, the evidence for each criterion comes from a different tool, and the synthesis happens in the clinician’s head or in a spreadsheet. Automated ACMG classification systems can apply the framework consistently, but only if they have access to all the relevant evidence layers.
For understanding the complete journey from initial variant finding to patient care, the variant-to-visit framework illustrates how genomic findings translate into clinical management.
Drug target assessment
For research teams, the pipeline extends beyond clinical classification into drug target discovery. A variant that causes loss of function in a critical protein is not just a diagnostic finding. It can point to a drug target. If a protein’s dysfunction drives disease, then restoring or modulating that protein’s activity becomes a therapeutic strategy.
The connection from variant interpretation to drug target assessment illustrates why the full pipeline matters. AI is compressing drug discovery timelines precisely because it can traverse this path faster: from identifying a dysfunctional protein, to modeling its structure, to predicting binding sites, to screening candidate compounds. What used to require separate research programs spanning years can now be initiated in a single analysis session.
The End-to-End Example: A Novel Variant in Dilated Cardiomyopathy
To make this concrete, let us walk through a complete case. This scenario is representative of how integrated analysis works in practice.
The starting point
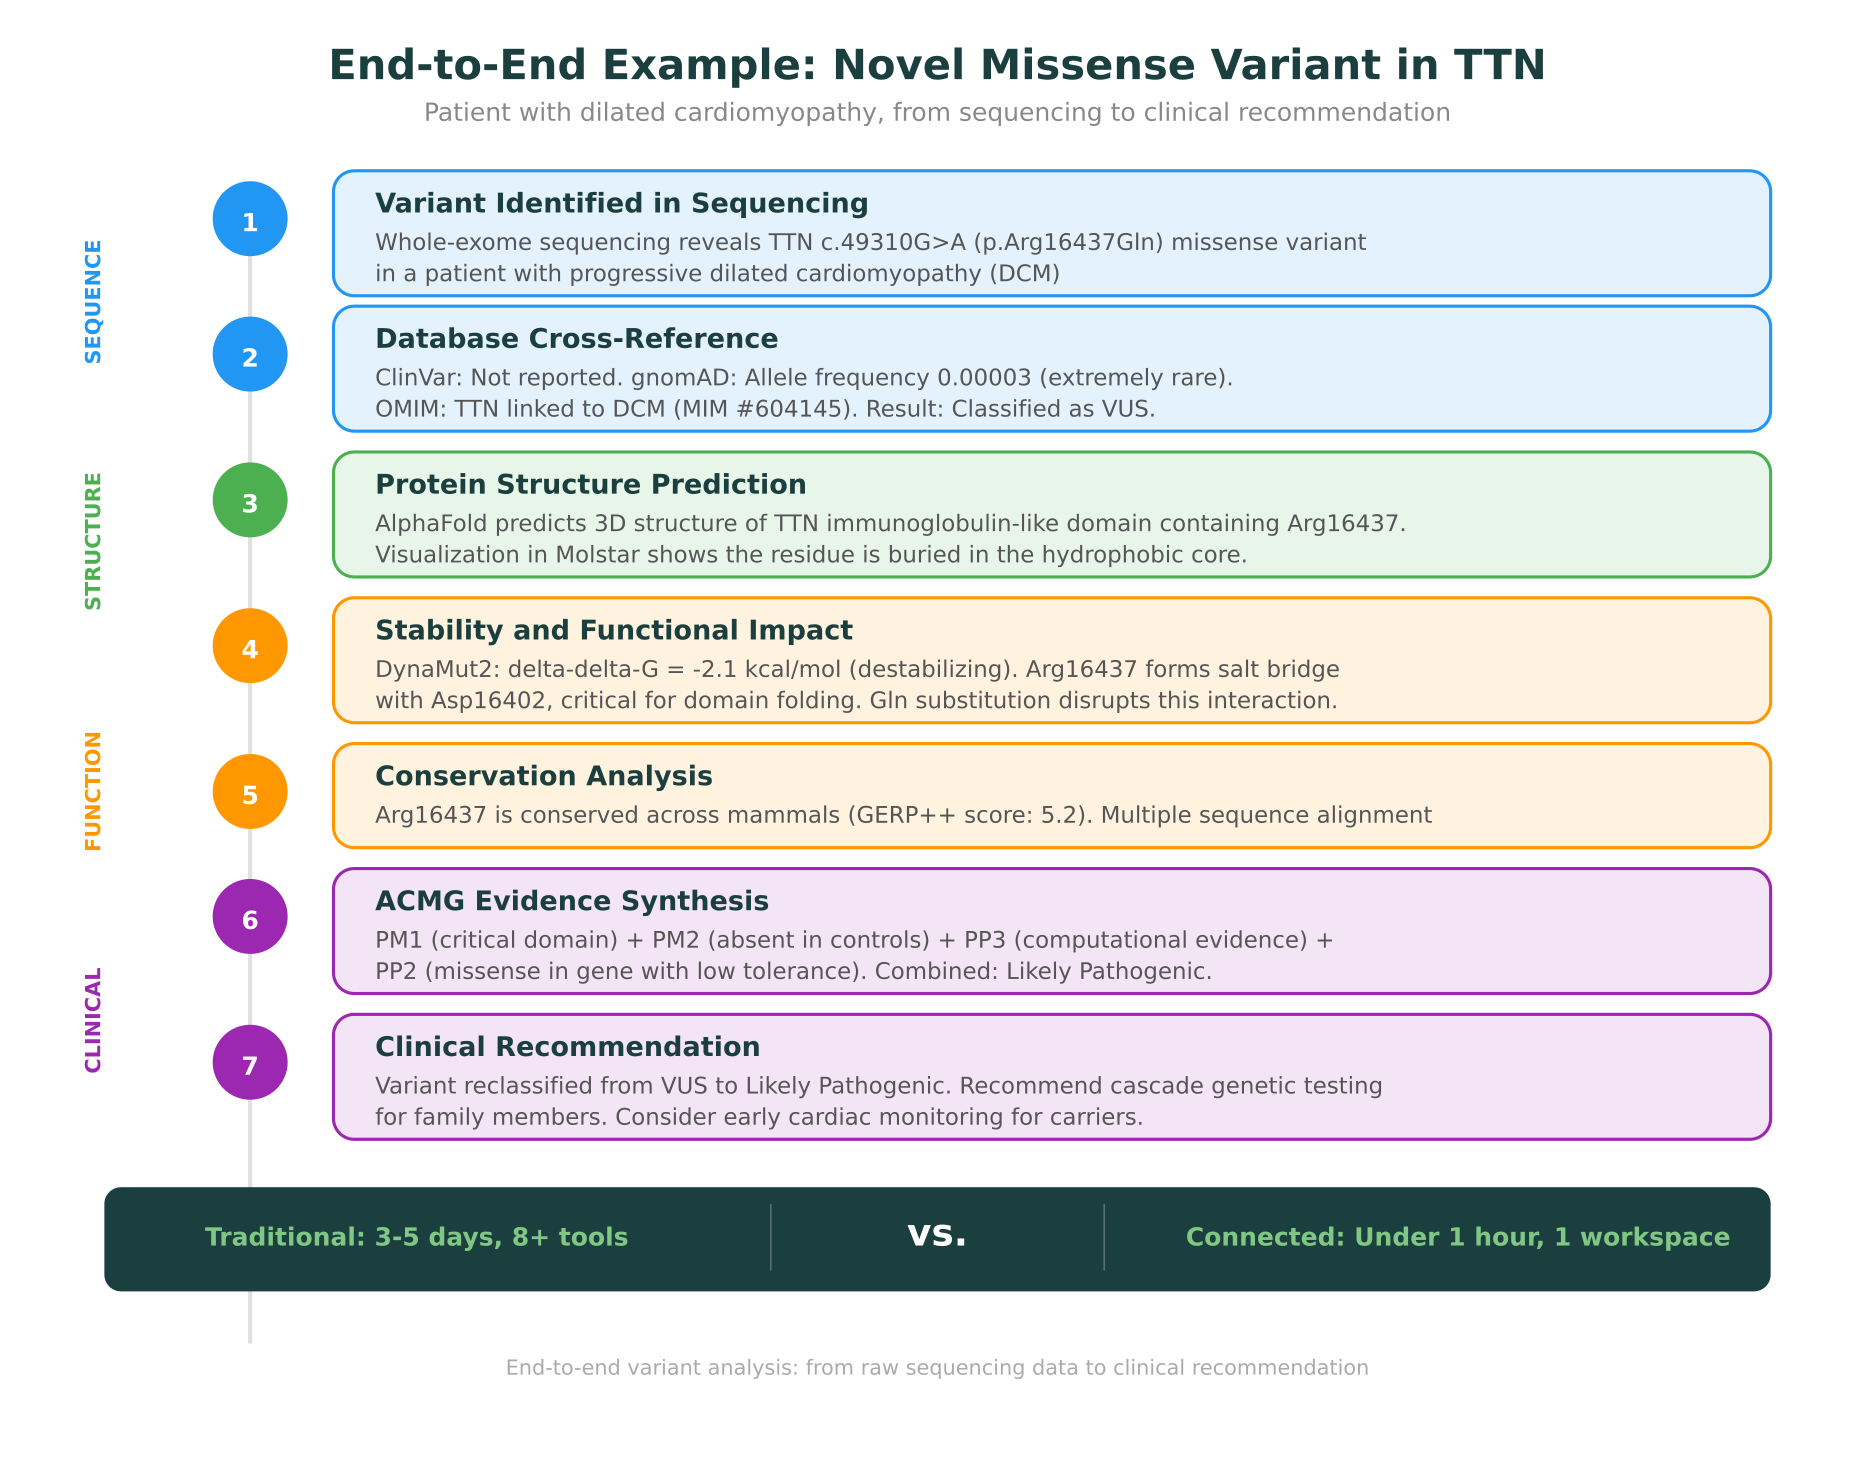
A 42-year-old patient presents with progressive dilated cardiomyopathy (DCM). Whole-exome sequencing is performed, and among the filtered variants, one stands out: a novel missense variant in TTN (titin), the largest human protein and a known DCM-associated gene. The variant is TTN c.49310G>A, resulting in a p.Arg16437Gln amino acid change.
Step 1: What do the databases say?
The variant is queried against ClinVar, gnomAD, and OMIM. ClinVar has no entry for this specific variant. gnomAD shows an allele frequency of 0.00003, making it extremely rare. OMIM confirms that TTN is linked to dilated cardiomyopathy (MIM #604145). Based on this evidence alone, the variant is classified as a VUS. There is not enough population or clinical data to determine its significance.
In a traditional workflow, this might be where the analysis stalls. The clinician reports it as a VUS, and the patient gets no actionable answer. But the pipeline does not have to stop here.
Step 2: What does the structure show?
The affected protein domain is pulled from the AlphaFold Protein Structure Database. TTN is enormous (over 34,000 residues), but the analysis can focus on the immunoglobulin-like domain containing position 16437.
The predicted structure shows that Arg16437 is buried in the hydrophobic core of the domain. This is immediately informative: surface residues tolerate substitutions more easily than buried ones, because surface changes do not disrupt the protein’s fold. A buried arginine being replaced by glutamine suggests a potential structural impact.
Visualization in Molstar confirms the residue’s position and reveals that Arg16437 appears to form a salt bridge with a nearby aspartate residue (Asp16402), a charged interaction that stabilizes the domain’s fold.
Step 3: How does the mutation affect function?
DynaMut2 predicts a delta-delta-G of -2.1 kcal/mol for the Arg16437Gln substitution. This is a strongly destabilizing change, consistent with the structural observation that the mutation disrupts a salt bridge in the protein core.
Conservation analysis shows that position 16437 is an arginine in all sequenced mammalian orthologs of titin, with a GERP++ score of 5.2 (highly conserved). The domain itself is an immunoglobulin-like fold that is repeated many times in titin, and mutations in these domains have been previously associated with cardiomyopathy.
Step 4: What is the classification?
Now the evidence can be synthesized using the ACMG framework:
- PM1 (located in a critical functional domain): The variant is in a conserved Ig-like domain of titin, in a structurally important position.
- PM2 (absent from controls): The variant is extremely rare in gnomAD (frequency 0.00003).
- PP3 (computational evidence supports damaging effect): DynaMut2 predicts strong destabilization; the variant disrupts a conserved salt bridge.
- PP2 (missense variant in gene with low rate of benign missense variation): TTN missense variants in certain domains are enriched in DCM patients.
The combination of PM1 + PM2 + PP3 + PP2 reaches the threshold for Likely Pathogenic under the ACMG framework.
The clinical recommendation
The variant is reclassified from VUS to Likely Pathogenic. The clinical team recommends cascade genetic testing for the patient’s first-degree relatives. Carriers should be offered cardiac monitoring with echocardiography and electrocardiography, as early detection and management of DCM significantly improves outcomes.
What changed?
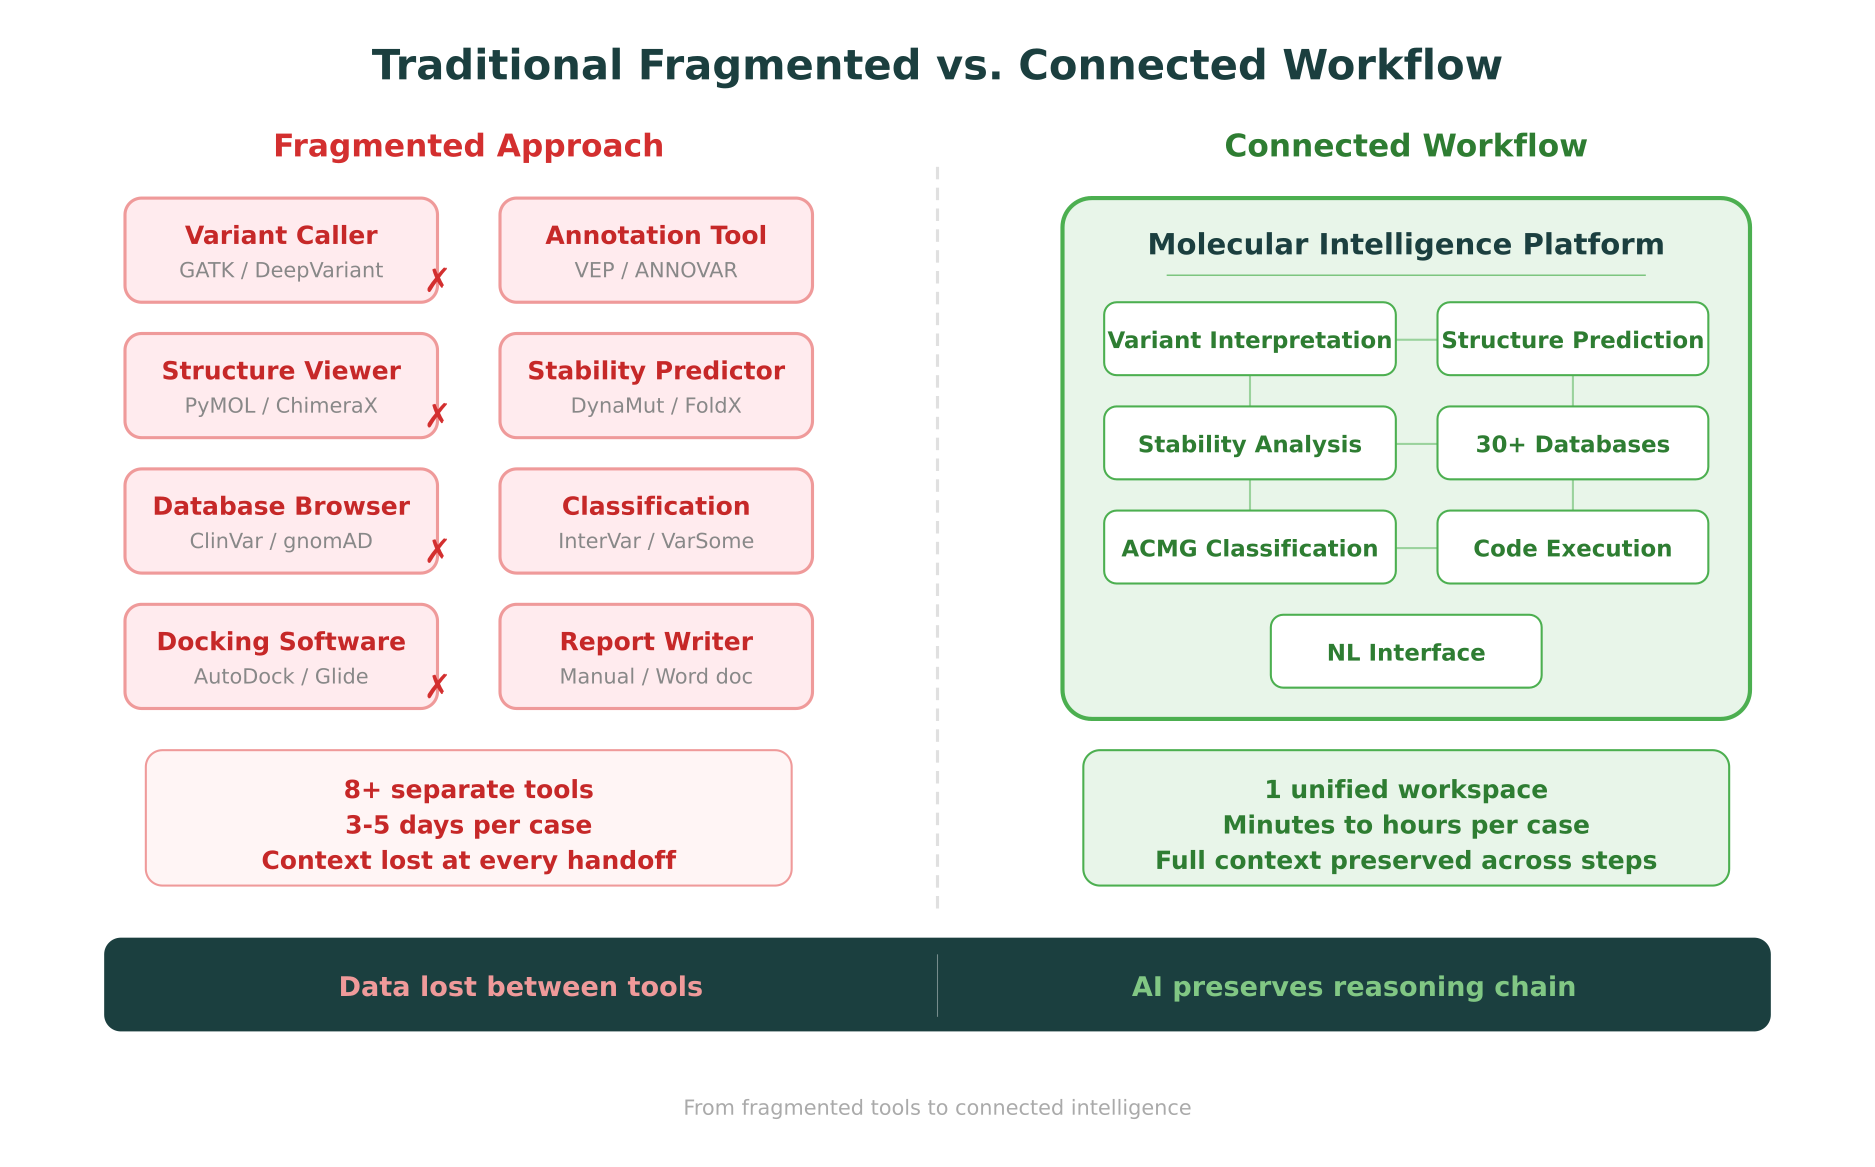
In the traditional fragmented workflow, this analysis would have required:
- A variant calling pipeline (GATK/DeepVariant)
- Multiple database browsers (ClinVar, gnomAD, OMIM)
- A structure prediction query (AlphaFold database)
- A molecular visualization tool (PyMOL or ChimeraX)
- A stability prediction tool (DynaMut2 web server)
- Conservation analysis tools (GERP++, multiple sequence alignment)
- An ACMG classification tool (InterVar or manual application)
- A clinical report generator
That is eight separate tools, each with its own interface, data format, and learning curve. The context from Step 2 (where the residue sits in the structure) does not automatically inform Step 3 (stability prediction), and the cumulative evidence does not automatically flow into Step 4 (ACMG classification). A researcher or clinician would need to manually synthesize findings at each stage.
In a connected workflow, the entire analysis runs in a single workspace, and the AI reasoning layer carries context from one step to the next.
How Molecular Intelligence Connects the Dots
The concept behind molecular intelligence is that AI should not just be good at individual tasks. It should be the connective tissue between them.
A variant caller that does not know about protein structure cannot assess whether a missense variant affects a buried or surface residue. A stability predictor that does not know the variant’s population frequency cannot weigh structural evidence against epidemiological evidence. An ACMG classifier that does not have access to structural and functional data will miss computational evidence criteria.
Molecular intelligence is what happens when all of these information sources are connected through a single AI reasoning layer that can traverse them during a single analysis. It is not a replacement for any individual tool. It is the infrastructure that connects them.
This is analogous to the shift from using separate command-line tools to using an integrated development environment (IDE) in software engineering. The individual components (compiler, debugger, version control, documentation) existed before the IDE. What the IDE provided was the connection between them, reducing context switching and enabling workflows that were not possible when each tool ran in isolation.
The database layer
One of the critical enablers of connected workflows is integrated database access. A typical variant analysis might require data from ClinVar (clinical significance), gnomAD (population frequency), OMIM (gene-disease associations), UniProt (protein domains and annotations), PDB (experimental structures), PharmGKB (pharmacogenomics), and LOVD (locus-specific databases).
In a fragmented workflow, each database requires a separate query, often with different query formats and identifiers. Querying biological databases using natural language removes this friction. Instead of knowing that ClinVar uses variation IDs while gnomAD uses genomic coordinates, a researcher can ask a question in plain English and have the system query the right databases with the right identifiers.
The computational layer
Connected workflows also require the ability to run custom analyses without leaving the workspace. When a standard tool does not exist for a specific question, or when a researcher needs to combine data in a novel way, the ability to write and execute code directly in the analysis environment matters.
This is particularly important for teams that might not have deep computational expertise. Bioinformatics without coding has become feasible through natural language interfaces that can generate and execute analysis scripts from plain-language descriptions. A researcher who can describe what they need (“run a multiple sequence alignment for this protein across mammalian orthologs and calculate conservation scores”) can get results without writing Python or R themselves.
The Multi-Omics Dimension
The sequence-to-structure-to-function pipeline described above follows a single data type: DNA sequence through protein structure to protein function. But biology does not work in a single dimension. The same variant that affects a protein’s stability might also alter gene expression levels, change post-translational modification patterns, or disrupt protein-protein interaction networks.
This is where multi-omics analysis becomes essential. Genomic variants can be correlated with transcriptomic data (is the mutated gene expressed at different levels?), proteomic data (is the mutant protein present and stable in cells?), and metabolomic data (does the downstream metabolic pathway show changes?).
AI in proteomics has advanced to the point where mass spectrometry data can be integrated with genomic findings to provide protein-level confirmation of variant effects. If a genomic variant is predicted to destabilize a protein, proteomic data can confirm whether the protein is actually present at reduced levels in patient samples.
For rare disease diagnosis, the multi-omics dimension is especially powerful. Many rare disease variants are in non-coding regions or have effects that are not obvious from the sequence alone. Combining genomic, transcriptomic, and proteomic evidence increases the diagnostic yield for cases that would remain unsolved using genomics alone.
The Platform Shift: From Tools to Intelligence
The evolution described in this post is part of a broader shift in how biological analysis gets done. The field is moving from individual, specialized tools to integrated platforms that connect data, analysis, and reasoning.
This parallels what happened in other data-intensive fields. Financial analysis moved from spreadsheets to Bloomberg terminals. Software development moved from separate editors, compilers, and debuggers to integrated development environments. In each case, the value was not in replacing the individual components, but in connecting them.
For biology, this shift has been slower because the data types are more heterogeneous, the databases are more fragmented, and the reasoning is more domain-specific. But the building blocks are now in place: AI models that can predict structure, assess stability, classify variants, and synthesize evidence. What remains is the integration layer.
Comparing bioinformatics platforms in 2026 increasingly comes down to this question: does the platform connect the full pipeline, or does it handle only one step? Traditional pipeline runners like Galaxy and Terra excel at executing pre-defined bioinformatics workflows, but they do not natively connect sequencing outputs to structural analysis to clinical classification. Single-task tools like VarSome or Franklin handle variant classification well, but they do not extend to protein structure or drug target assessment.
The comparison of open-source and commercial platforms reveals a similar pattern: open-source tools are excellent at individual tasks, but connecting them into an end-to-end workflow requires significant engineering effort.
AI for biology is working in 2026 precisely in the areas where this integration is happening: where AI can reason across multiple data types and multiple analysis steps rather than optimizing a single computation in isolation.
What This Means for Research Teams
For teams that work across multiple steps of the biological analysis pipeline, the practical implications are significant.
Speed. An analysis that previously took three to five days across eight separate tools can now be completed in hours or less in a connected workspace. This matters not just for efficiency, but for the ability to iterate. When a hypothesis fails, a researcher in a connected workflow can adjust and re-analyze immediately rather than restarting a multi-day process.
Completeness. In a fragmented workflow, it is easy to skip a step because the effort of switching tools is too high. A clinician might report a variant as a VUS without checking the protein structure, simply because structural analysis requires different software and different expertise. In a connected workflow, every evidence layer is accessible from the same interface, which increases the likelihood that all relevant evidence is considered.
Reproducibility. When an entire analysis runs in a single workspace with a documented reasoning chain, it is easier to reproduce, audit, and share. The evidence for each ACMG criterion can be traced back to its source database and computational method.
Discovery. The most important effect may be the one that is hardest to measure: the ability to notice connections that would be invisible in a fragmented workflow. When structural analysis, functional prediction, clinical databases, and multi-omics data are all accessible in one session, a researcher can follow a thread of evidence wherever it leads, across data types and analysis methods, without the friction of switching tools.
Looking Forward
The sequence-to-structure-to-function pipeline is not new. Biologists have always known that understanding a gene requires understanding its product’s structure, and understanding structure requires understanding function. What is new is the ability to traverse this entire pipeline computationally, in a single session, with AI providing the reasoning that connects each step.
As structure prediction continues to improve, as functional models become more accurate, and as clinical databases grow, the value of the connected pipeline will only increase. Each individual component becomes more useful when it is connected to all the others.
The future of biological analysis is not a better variant caller, a better structure predictor, or a better stability model in isolation. It is the integration of all of these into a continuous reasoning chain where evidence flows seamlessly from sequence to structure to function, and where the AI’s role is not to replace expert judgment, but to ensure that every relevant piece of evidence is accessible, synthesized, and presented for the expert to evaluate.
This is what molecular intelligence looks like in practice. Not a single model, but an intelligent infrastructure that connects the full depth of biological data and reasoning into one workspace.
MIP is Purna AI’s Molecular Intelligence Platform, an AI-powered workspace for biology teams. Variant interpretation with ACMG/AMP classification, protein structure prediction and visualization in Molstar, stability analysis via DynaMut2, code execution in containerized environments, natural language database queries across 30+ sources, and multi-omics analysis, all in one place. Explore the platform at purna.ai, or apply for up to $10,000 in free research credits.
Explore Purna's Molecular Intelligence Platform
AI-powered workspace for biology teams to accelerate drug discovery from target identification to lead optimization.
Try Purna AI →
